

The formula
There are two standard ways to calculate DOL.
From two periods:
DOL = % change in operating income / % change in sales
From one period's cost structure:
DOL = contribution margin / operating income
Contribution margin is sales minus variable costs: the money left after the costs that rise and fall with each unit sold. Operating income is contribution margin minus fixed operating costs. The two methods give the same answer when costs behave as the model assumes, that is, when fixed costs stay fixed and variable costs stay a constant share of sales.
A DOL of 3 means a 1% change in sales produces about a 3% change in operating income, in the same direction.
Where operating leverage comes from
Fixed costs are the source. Common examples:
- Rent and leases on stores, offices and plants
- Salaried staff, including engineers and management
- Depreciation on equipment and buildings
- Software development that serves every customer at once
- Insurance, licences and much of general overhead
Variable costs scale with volume: raw materials, packaging, shipping, sales commissions, payment processing and hourly labor tied to output.
A software company that has built its product spends little to serve one more customer, so its variable costs are low and its DOL is high. A distributor that buys goods and resells them at a markup has most of its costs in the goods themselves, so its DOL is lower. Our explainer on the income statement shows where these costs appear.
Worked example: two companies, same sales
| Company A (high fixed costs) | Company B (high variable costs) | |
|---|---|---|
| Sales | $100M | $100M |
| Variable costs | $30M (30% of sales) | $80M (80% of sales) |
| Contribution margin | $70M | $20M |
| Fixed costs | $60M | $10M |
| Operating income | $10M | $10M |
| DOL (contribution margin / operating income) | 7.0 | 2.0 |
| Operating income if sales rise 10% | $17M (+70%) | $12M (+20%) |
| Operating income if sales fall 10% | $3M (-70%) | $8M (-20%) |
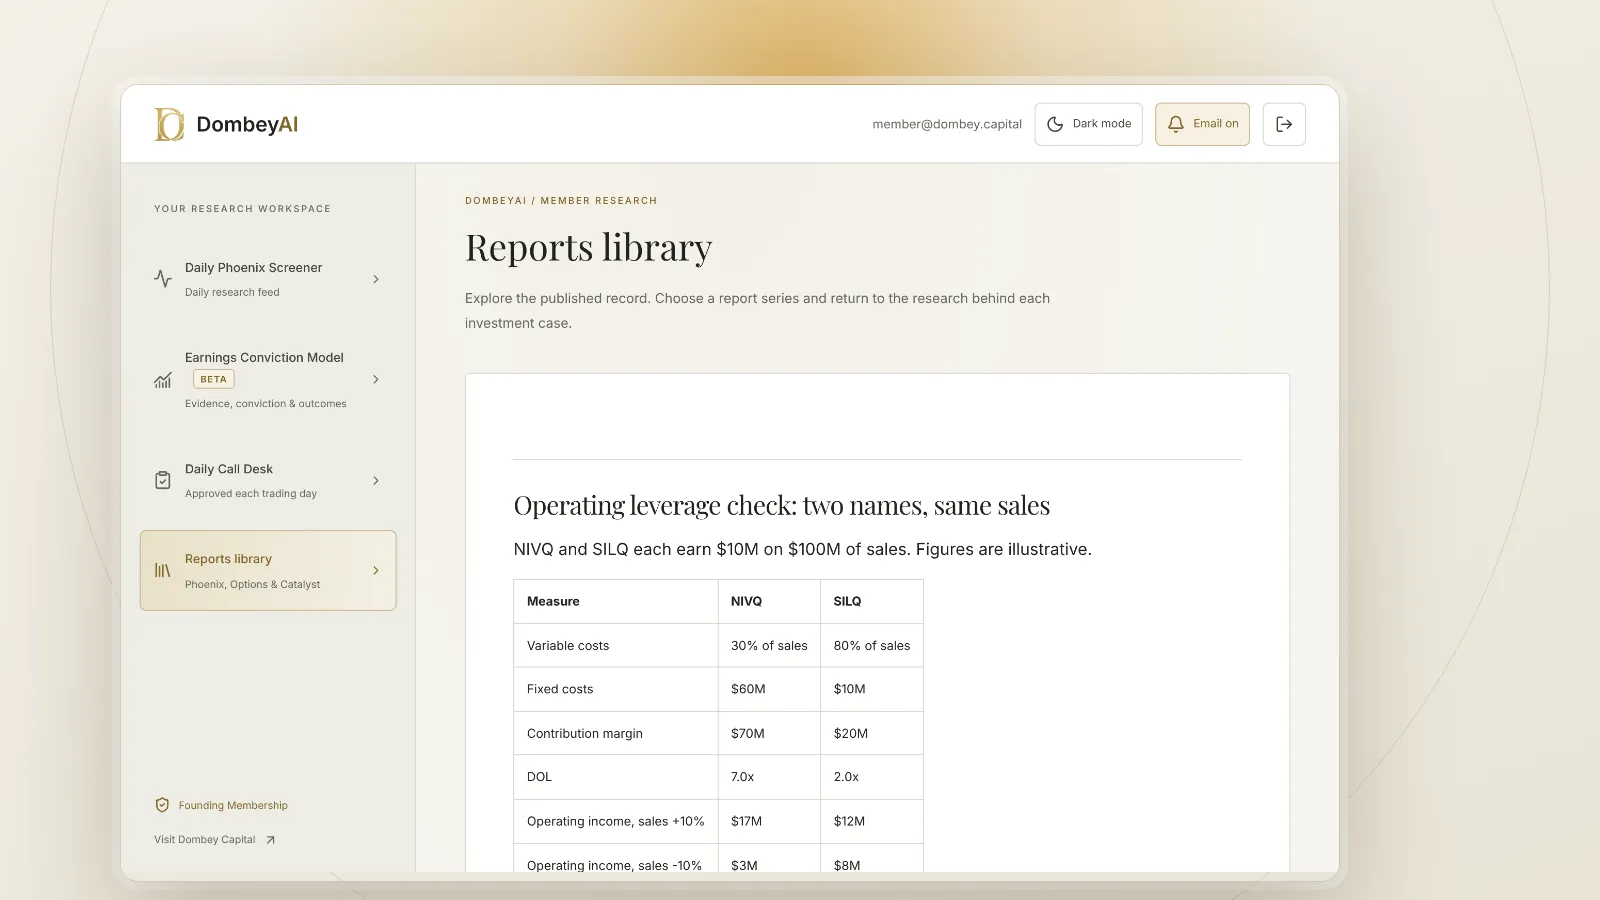
On the same starting numbers, a 10% move in sales changes Company A's operating income by 70% and Company B's by 20%. Company A earns far more in a good year and comes close to a loss in a bad one.
The example also shows why a price-to-earnings ratio alone can mislead. Both companies earn $10 million today. A reader who values them alike is ignoring that one company's earnings are about three and a half times as sensitive to sales.
Why DOL changes with the level of sales
DOL is not a fixed trait of a company. It depends on how far sales sit above break-even.
At break-even, operating income is zero, so DOL is undefined: any sales change is an infinite percentage change in profit. Just above break-even, DOL is very high. As sales grow, fixed costs become a smaller share of revenue and DOL falls toward 1.
Take Company A again. At $100 million in sales its DOL is 7. If sales grow to $150 million, its contribution margin is $105 million and operating income $45 million, so DOL falls to about 2.3. The same company shows wild profit swings when it is small and steadier ones when it is large.
This is why a company recovering from a loss can show very large percentage profit gains on modest revenue growth, and why those percentages cannot be extended forward. Our explainer on normalized earnings covers how to look through a cycle.
How to estimate operating leverage from filings
Companies do not report their fixed and variable costs. Investors estimate them in three main ways.
Compare periods. Divide the change in operating income by the change in sales between two quarters or years. This is quick but noisy, since price changes, mix shifts and one-off items move margins as well.
Read the cost lines. Cost of goods sold is often mostly variable, and selling, general and administrative expense mostly fixed, though both contain some of each. Depreciation is fixed. The 10-K footnotes sometimes break costs out further.
Use incremental margins. Many companies discuss incremental or decremental margins on earnings calls: the share of each extra (or lost) dollar of revenue that reaches operating income. An incremental margin of 50% on a 10% base margin implies high operating leverage.
Operating leverage and financial leverage together
Operating leverage magnifies the step from sales to operating income. Financial leverage, from fixed interest costs, magnifies the step from operating income to net income. Multiply the two and you get the degree of total leverage, the sensitivity of earnings per share to sales.
A company with high operating leverage and heavy debt is the most fragile combination. A sales decline cuts operating income sharply, and fixed interest then takes a larger share of what is left. The interest coverage ratio and debt-to-equity ratio are the first checks on that second layer.
Why it matters for valuation and catalysts
Operating leverage changes how a valuation responds to news.
- Earnings reports. A small revenue beat at a high-DOL company can produce a large profit beat. Our explainer on earnings estimate revisions covers how such surprises feed into forecasts.
- Guidance changes. A modest cut in revenue guidance can mean a much larger cut in profit for the year.
- Cyclical turns. At the bottom of a cycle, earnings can be near zero, so multiples look extreme. At the top, peak margins can make the stock look cheap.
- Valuation multiples. Comparing EV to sales or EBITDA across companies with different cost structures can hide large differences in risk; see EV/EBITDA.
When building a model, setting costs as a constant share of sales removes operating leverage entirely. Splitting fixed and variable costs, even roughly, gives a more honest range of outcomes. The tools reviewed in our list of the best stock research tools for individual investors make the historical cost lines easier to pull.
Where this goes wrong
Treating fixed costs as permanently fixed. Management can close plants, cut staff and renegotiate leases. Over a year or two, many fixed costs become variable, so DOL overstates the long-run damage of a downturn.
Ignoring step costs. Some costs are fixed only up to a point. A plant at full capacity needs a new line, which adds a block of fixed cost and resets DOL.
Reading price as volume. A price increase with no change in volume has almost no variable cost attached, so its margin effect is larger than a volume increase of the same revenue. DOL formulas mix the two.
Using it near break-even. Close to break-even, DOL becomes very large and unstable. Small errors in the cost split produce very different answers.
Missing mix shifts. If a company sells more of a low-margin product, operating income can fall even as revenue rises. That looks like negative operating leverage but has a different cause.
The bottom line
Operating leverage measures how much operating profit moves for a given change in sales, and it comes from fixed costs. A high DOL means bigger gains when sales rise and bigger losses when they fall, and it is highest just above break-even. Estimate it as a range, because companies do not disclose the fixed and variable split. Read it together with financial leverage to see how much earnings can swing.