

The formula
Interest coverage = EBIT / interest expense
EBIT is earnings before interest and taxes, which for most companies is close to reported operating income. Interest expense is the cost of borrowing for the same period. Both come from the income statement, and Regulation S-X requires interest expense to be shown as its own line item, so it is usually easy to find in the 10-K or 10-Q.
Use trailing twelve months. A single quarter can be distorted by seasonality, and a full fiscal year can be a year out of date. Add the latest four quarters, or take the last annual figure, add the year-to-date results and subtract the same period of the prior year.
Two details change the answer more than people expect:
- Gross, not net, interest. Some companies report "interest expense, net", which subtracts interest earned on cash. A company with large cash balances can look well covered on net interest while its debt is expensive. The notes usually give the gross figure.
- Capitalized interest. Companies building plants or properties can capitalize part of their interest into the cost of the asset, so it never appears as expense. The cash still leaves. Check the debt note or the cash flow statement for interest paid.
Variations: EBIT, EBITDA and cash coverage
Analysts use three common versions, and they can tell very different stories about the same company.
| Version | Formula | What it shows | Where it misleads |
|---|---|---|---|
| EBIT coverage | Operating income / interest expense | Whether profits after asset wear cover interest | Understates cash for businesses with large, non-cash amortization |
| EBITDA coverage | EBITDA / interest expense | Cash earnings available before capital spending | Ignores the cost of replacing equipment |
| Cash coverage | (Operating cash flow + interest paid + taxes paid) / interest paid | Whether actual cash covered actual interest | Swings with working capital from quarter to quarter |
| Fixed-charge coverage | (EBIT + lease costs) / (interest + lease costs) | Coverage including rent-like obligations | Definitions vary between lenders and data providers |
EBIT coverage is the stricter test and the best starting point. EBITDA coverage is what most loan covenants and many credit ratings use, so it matters for whether a lender can step in. If a company only looks safe on EBITDA, it usually has heavy capital needs, and EV/EBITDA's blind spots apply here too. If you want to see how reported cash compares with reported profit, how to read a cash flow statement walks through it.
What counts as safe
There is no single safe number, but the rough bands below are widely used for ordinary operating companies:
| Coverage (EBIT / interest) | Usual reading | What to check next |
|---|---|---|
| Above 8x | Very comfortable; debt is a small cost | Whether the company could carry more debt or buy back stock |
| 3x to 8x | Comfortable for most businesses | How much earnings could fall in a bad year |
| 1.5x to 3x | Thin; a downturn could squeeze it | Floating-rate share, covenants, next maturity |
| 1.0x to 1.5x | Warning; little room for error | Liquidity, asset sales, refinancing plans |
| Below 1.0x | Earnings do not cover interest | Cash runway, going concern language, restructuring advisers |
What counts as safe depends on how stable the earnings are. A regulated utility or a property owner with long leases can run at 2x to 3x for years without trouble, because its income is predictable. A chipmaker, a homebuilder or a commodity producer at 3x can drop below 1x in one bad year, because its earnings can halve. The more cyclical the business, the higher the coverage you want before calling it safe.
Worked example
Now look forward. Half of Company A's $500 million of debt is a floating-rate term loan, and a $200 million fixed-rate note at 4% matures next year. Suppose the note refinances at 8% and floating rates stay flat. Interest on that note rises from $8 million to $16 million, lifting total interest to $38 million. Coverage falls to about 3.2x before anything happens to the business.
Then suppose a slowdown cuts operating income by 30%, to $84 million. Coverage drops to 84 / 38, about 2.2x. Nothing in the trailing figures showed that: the risk sat in the debt note and the maturity schedule.
Company B, a software firm with the same 4.0x coverage, has only fixed-rate notes due in six years and recurring revenue that barely fell in the last recession. Its 4.0x means far more than Company A's.
How to calculate it from a filing
- Open the latest 10-K and any later 10-Qs on EDGAR.
- Take operating income from the income statement and build a trailing twelve-month figure.
- Find interest expense. If the line says "net", go to the notes for gross interest expense and interest income.
- Read the debt note for each borrowing's rate, whether it is fixed or floating, and its maturity date.
- Check the cash flow statement or supplemental disclosures for interest paid, and compare it with interest expense. A large gap points to capitalized interest or payment-in-kind interest that is added to the debt instead of paid.
- Look for a coverage covenant in the credit agreement, usually filed as an exhibit, and note how the agreement defines EBITDA.
- Recalculate coverage on next year's likely interest bill, using current rates for floating debt and refinancing rates for anything that matures.
Where this goes wrong
Interest coverage is simple, which is why it is often misread.
- Adjusted earnings. Companies sometimes present coverage built on adjusted EBITDA, which adds back restructuring costs, stock compensation and other items. Regulation G requires a reconciliation to the nearest GAAP measure, so start from the reported number and decide which add-backs you accept.
- Trailing figures at a turning point. Coverage based on peak earnings looks strongest just before earnings fall. Cyclical companies need a mid-cycle or trough estimate.
- Rate resets. Floating-rate debt, swaps that expire and notes that refinance at higher rates can change interest expense quickly. The trailing ratio reflects the old rates.
- Payment-in-kind interest. Some debt lets the borrower add interest to the principal instead of paying cash. Expense may be recorded, but the cash pressure is deferred and the debt grows.
- No view of principal. A company can cover interest five times and still be unable to repay a large note when it matures. Coverage must be read alongside the maturity schedule and debt against earnings.
- Holding companies and subsidiaries. Coverage at the consolidated level can hide a parent company that depends on dividends from subsidiaries whose own lenders restrict those payments.
How investors use it
For equity investors, coverage works best as a screen and a stress test, not a verdict.
- If coverage is above about 5x and debt matures well beyond the next two years, debt is unlikely to drive the outcome, and the valuation work can focus elsewhere.
- If coverage is between 1.5x and 3x, model next year's interest bill line by line and test a downturn in earnings.
- If coverage is below 1.5x, read the liquidity section of the 10-Q, check for a going concern paragraph, and treat the equity as an option on a refinancing.
- If coverage is falling quarter after quarter while debt is flat, the problem is earnings, and the ratio is a symptom.
Coverage also fits into broader distress measures. The Altman Z-score uses EBIT against total assets rather than interest, so the two measures catch different weaknesses. Most screening platforms list interest coverage as a standard field; the best stock research tools for individual investors compares which ones let you screen and chart it. Check how each defines the ratio before relying on it, because some use EBITDA or net interest by default.
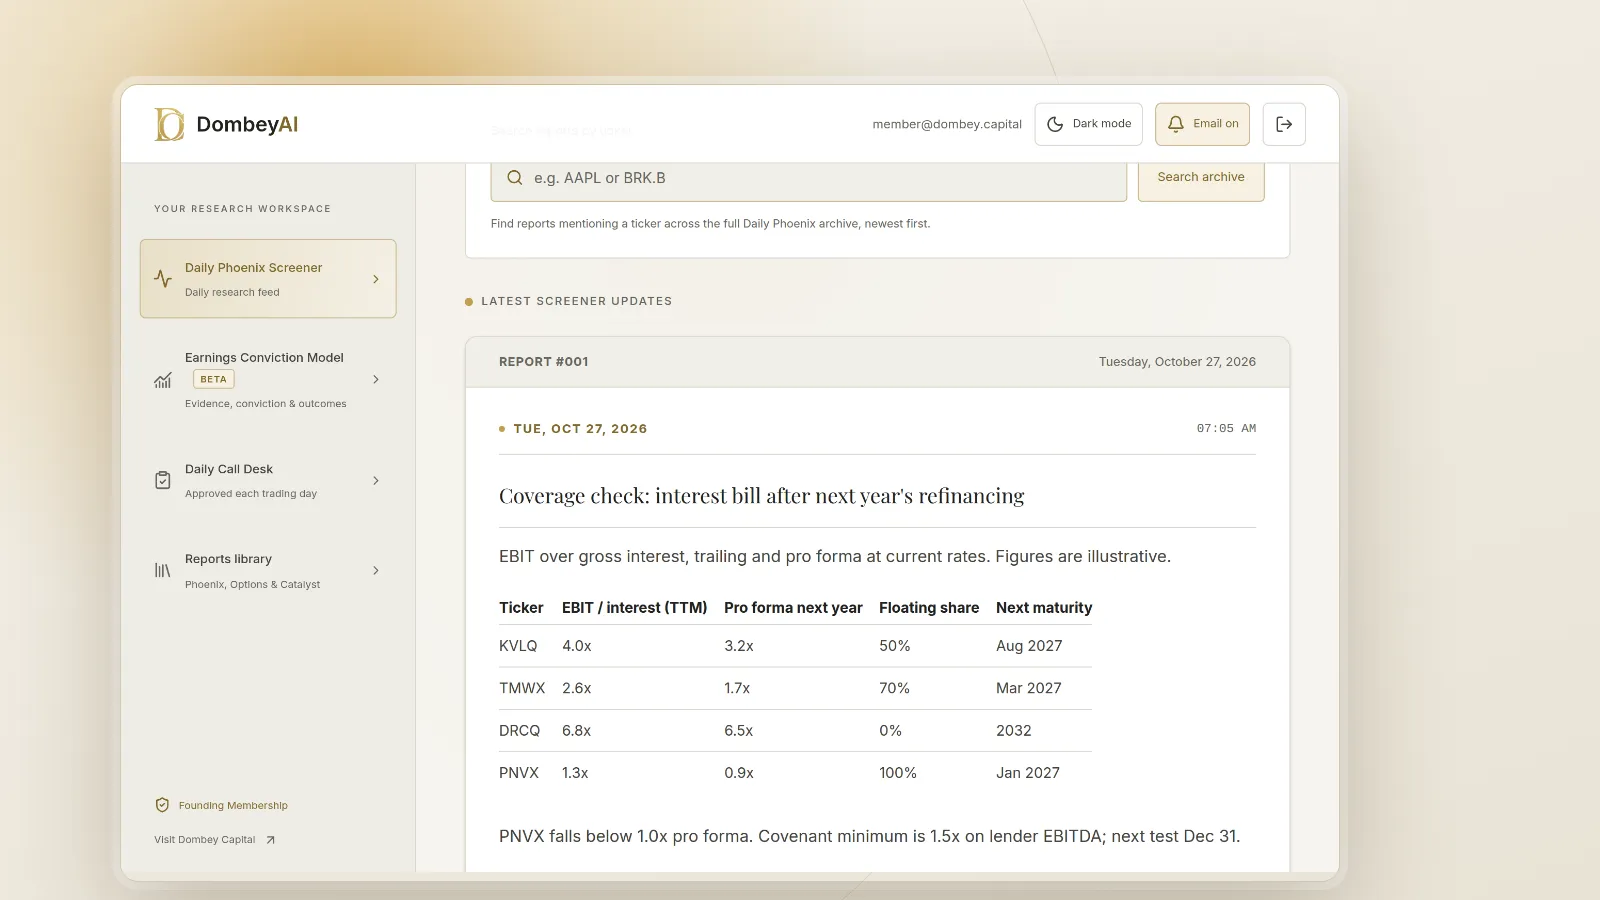
Dombey's published research includes coverage on next year's expected interest bill when debt bears on a catalyst; see the research archive.
The bottom line
The interest coverage ratio divides operating earnings by interest expense and tells you how comfortably a company can pay for its debt. Above about 3x is comfortable for most businesses, below 1.5x is a warning and below 1.0x means earnings do not cover interest. The trailing figure is only a start: recalculate it on next year's interest bill, test it against a drop in earnings, and read it alongside the maturity schedule. A company's safety depends on the stability of its earnings as much as the ratio itself.