

A short definition
The formula is:
ROA = net income / average total assets
Average total assets is usually the mean of the opening and closing balance sheets for the year. Using the average avoids distortion when a company makes a large acquisition or raises capital partway through the year.
ROA answers a narrower question than it seems to. It does not say whether a business is a good investment. It says how productive the balance sheet is, and it is most useful when the balance sheet is the business: banks, insurers, lessors and other asset-heavy companies.
Real examples by industry
ROA varies more by industry than by company quality. The asset base each business needs sets the range.
| Business type | What the assets are | Why ROA looks the way it does |
|---|---|---|
| Commercial banks | Loans and securities funded mostly by deposits | Thin margins on a large balance sheet; around 1% has long been treated as a solid year, and the FDIC reports the industry figure each quarter |
| Insurers | Investment portfolios backing reserves | Large float relative to profit keeps ROA low |
| Utilities | Power plants, grids and pipes | Regulated returns on a heavy, long-lived asset base |
| Retailers | Inventory, stores and receivables | Moderate; fast inventory turns lift it |
| Software and services | Cash, receivables and capitalized intangibles | Few physical assets, so ROA can be high, unless large acquisitions add goodwill |
This is why comparing a bank's ROA with a software company's tells you nothing. Compare within an industry and against the company's own history.
ROA and the DuPont breakdown
ROA can be split into two parts:
ROA = (net income / revenue) x (revenue / average assets)
The first part is net margin. The second is asset turnover, how much revenue each dollar of assets produces. A grocer earns a thin margin on a high turnover; a utility earns a fuller margin on a low turnover. Both can reach the same ROA by different routes.
Adding leverage gives return on equity:
ROE = ROA x (average assets / average equity)
This is the full DuPont identity covered in what return on equity measures. It shows why ROA is a useful check on ROE: a company can raise its ROE simply by borrowing more, while ROA stays flat. When ROE rises and ROA does not, the improvement came from the balance sheet, not the business.
Operating ROA and ROIC
Net income is after interest expense, so standard ROA mixes financing into what is meant to be an asset measure. Two companies with identical operations will show different ROAs if one is debt-funded, because its interest expense lowers net income.
Analysts fix this in one of two ways:
- Add back after-tax interest. Use net income plus interest expense times one minus the tax rate. The result is the return on assets before financing.
- Use ROIC instead. Return on invested capital uses after-tax operating profit over debt plus equity, usually excluding excess cash. For most operating companies it is the better measure of business quality.
For banks, plain ROA is the norm, because interest expense is the cost of the raw material, not a financing choice.
Worked example
| Measure | Company A | Company B |
|---|---|---|
| Net income | $60 million | $45 million |
| Average assets | $5.0 billion | $5.0 billion |
| ROA | 1.2% | 0.9% |
| Average equity | $400 million | $600 million |
| Assets over equity | 12.5x | 8.3x |
| ROE | 15.0% | 7.5% |
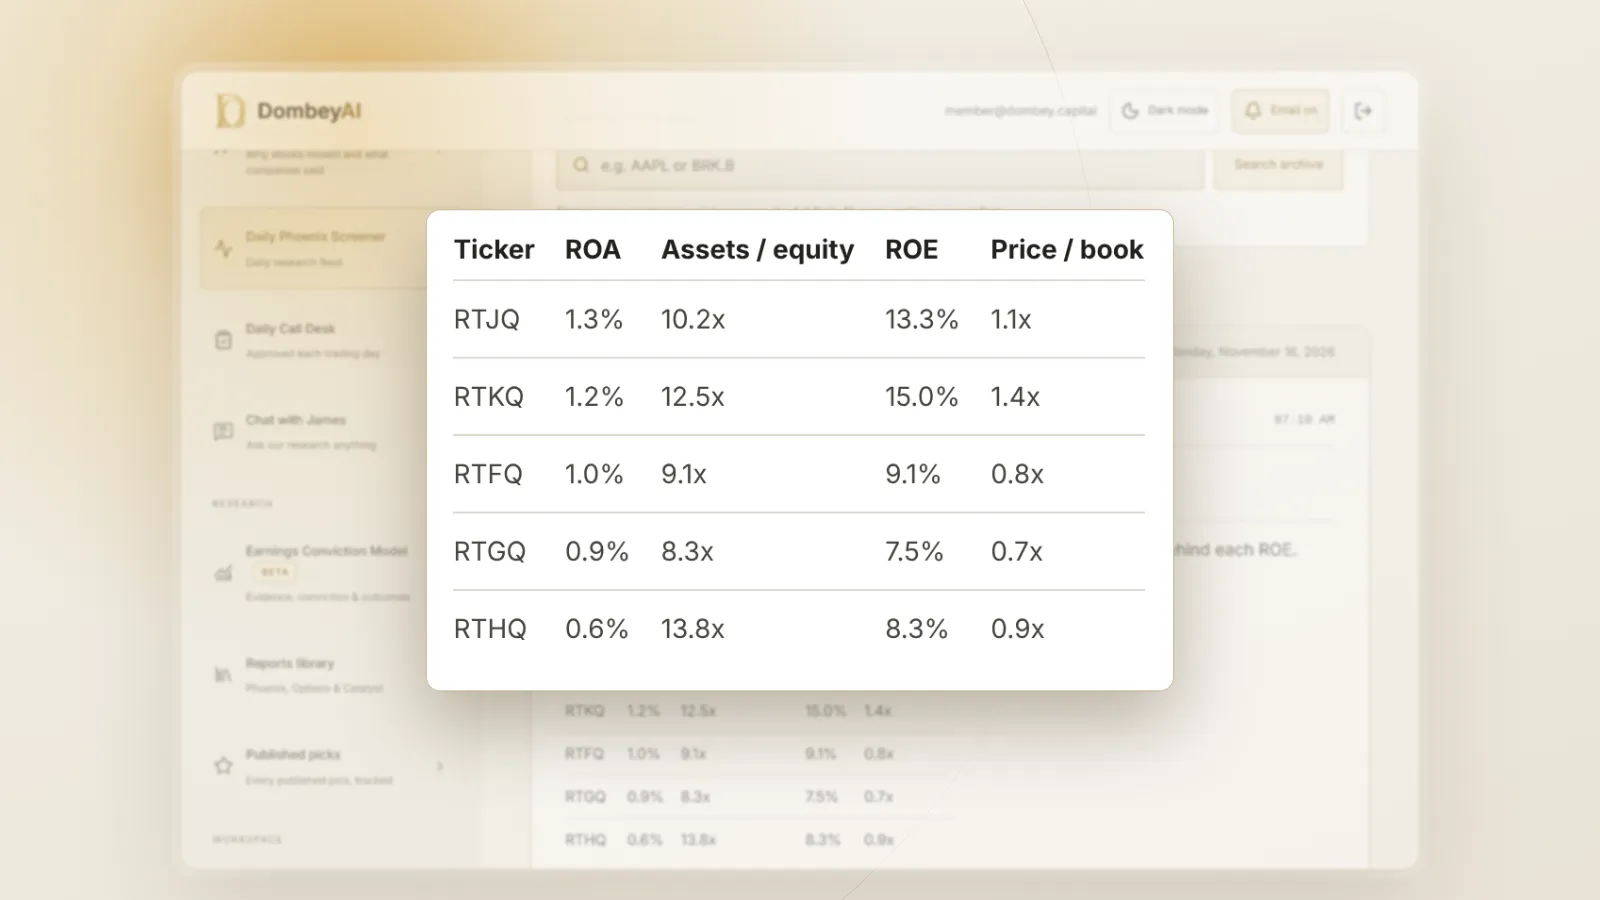
Company A's ROE is twice Company B's. Most of the gap comes from leverage: A runs 12.5 times assets to equity, B runs 8.3 times. A's ROA is also higher, so it is earning more on its loans, but not twice as much. If a downturn raises loan losses, the more leveraged lender's equity absorbs a larger share of each dollar lost.
This is the pattern to look for when you value a bank stock: ROA tells you about lending quality, and the equity multiplier tells you how much risk sits on top of it.
How to use ROA in research
ROA is most useful in four situations.
- Screening banks and lenders. Sorting by ROA and then checking capital ratios separates well-run lenders from leveraged ones. Pair it with price-to-book, since bank valuations are usually read against book value.
- Tracking a turnaround. A rising ROA over several years, with assets flat, shows that the company is earning more from what it already owns.
- Spotting asset bloat. If assets grow faster than profit, ROA falls. That often follows an acquisition paid for with goodwill, or a build-up of inventory and receivables.
- Testing an asset-heavy value idea. A stock trading below book value with a low ROA may be cheap for a reason. Earning 2% on assets funded at 6% destroys value each year.
Most data platforms show ROA by default. Our list of the best stock research tools for individual investors covers which ones let you see the history and the inputs, which matters more than the headline figure.
What distorts the denominator
Total assets is an accounting number, and several items can make it misleading:
- Goodwill and intangibles. Acquirers carry goodwill that inflates assets, lowering ROA relative to a company that grew without acquisitions. Read the notes on goodwill and impairments, and consider computing ROA on tangible assets.
- Write-downs. An impairment lowers assets and can lift ROA in later years without any operating change.
- Old assets at historical cost. A company with fully depreciated plants shows a small asset base and a high ROA. A competitor with new plants shows the opposite, even if both run equally well.
- Excess cash. A large cash pile earning little drags ROA down. For an operating comparison, consider excluding cash beyond what the business needs.
- Leases. Since lease accounting changes in 2019, right-of-use assets sit on the balance sheet, which lowers ROA for lease-heavy companies compared with earlier years.
Reading the asset side of the balance sheet before trusting the ratio takes a few minutes and avoids most of these traps.
A quick checklist
Before using an ROA figure from a screen or a data page, run through these checks. Each takes a minute with the 10-K open.
| Step | What to check | Where to find it |
|---|---|---|
| 1 | Is net income distorted by a one-off gain, loss or impairment? | Income statement and the notes on unusual items |
| 2 | Were average assets used, or year-end assets? | The data provider's definition, or your own calculation |
| 3 | How much of total assets is goodwill and intangibles? | Balance sheet and the acquisitions note |
| 4 | How much is excess cash? | Balance sheet and liquidity discussion |
| 5 | Is the figure in line with peers in the same industry? | Peer filings or a peer screen |
| 6 | Is ROA trending up or down over five years? | Five years of 10-K data |
If the answers point to a distorted figure, recompute ROA on tangible assets, or use an adjusted net income, before comparing it with peers. A ratio that survives these checks is worth using; one that does not is a prompt to read further.
Where this goes wrong
The common mistakes:
- Comparing across industries. A 3% ROA is weak for a software company and strong for a bank.
- Ignoring leverage. ROA looks the same for two companies whose risk is very different, because it does not show how the assets are funded.
- Using a single year. One-off gains, losses and write-downs swing net income. Use several years or an adjusted figure.
- Mixing period-end and average assets. Comparisons only work when the same method is used throughout.
The bottom line
Return on assets is net income divided by average total assets: the profit a company earns on everything it owns. It is a core measure for banks and other balance-sheet businesses, and a useful check on return on equity because it strips out leverage. It is a poor tool for comparing companies across industries, and its denominator is shaped by acquisitions, write-downs and asset age. Use it alongside ROE and ROIC, over several years, and read the balance sheet behind it.