

What you need
- The latest 10-K and 10-Q. Both are free on SEC EDGAR. The 10-K has two year-end balance sheets; the 10-Q compares the latest quarter-end with the last year-end.
- The notes to the financial statements. Most balance sheet lines have a footnote.
- The cash flow statement. It explains the changes between balance sheet dates.
- The share count. It is on the cover of the 10-Q or 10-K and in the equity footnote.
Step 1: Learn the layout
US companies present the balance sheet in a standard order.
| Section | Typical lines | What it tells you |
|---|---|---|
| Current assets | Cash, short-term investments, receivables, inventory, prepaid expenses | What turns into cash within a year |
| Non-current assets | Property, plant and equipment, right-of-use lease assets, goodwill, intangibles, long-term investments, deferred tax assets | What the business uses over many years |
| Current liabilities | Accounts payable, accrued expenses, deferred revenue, current portion of debt and leases | What must be paid within a year |
| Non-current liabilities | Long-term debt, lease liabilities, pension obligations, deferred tax liabilities | What is owed beyond a year |
| Shareholders' equity | Common stock, additional paid-in capital, retained earnings or accumulated deficit, treasury stock, other comprehensive income | What is left for shareholders |
Assets are listed roughly in order of liquidity, liabilities roughly in order of when they come due.
Step 2: Check cash and debt first
Add cash, cash equivalents and short-term investments. Then add every line of borrowed money: short-term borrowings, the current portion of long-term debt and long-term debt. The difference is net cash or net debt.
Then read the debt footnote for maturities, interest rates and covenants. A company with $200 million of debt due in nine months and $50 million of cash has a problem the total does not show. Our explainers on debt maturity walls and the interest coverage ratio cover what to do with those numbers.
Step 3: Read working capital
Working capital is current assets minus current liabilities. More useful than the total is how each piece moves relative to sales.
- Receivables growing faster than revenue can mean customers are paying more slowly or revenue is being recognized early.
- Inventory growing faster than sales can mean demand is weakening.
- Payables stretching can boost cash flow for a while, but suppliers eventually push back.
- Deferred revenue is cash collected before the work is done; it rises in healthy subscription businesses.
Our guide to working capital covers the ratios in detail.
Step 4: Look at long-term assets
Property, plant and equipment is recorded at cost less accumulated depreciation, not market value. Land is not depreciated at all, so land bought decades ago can be worth far more than its carrying value, a point covered in our explainer on real estate hidden in balance sheets.
Goodwill and acquired intangibles arise from acquisitions. They are not cash and cannot be sold separately. A large goodwill balance tells you the company paid more than the fair value of identifiable net assets, and an impairment later shows the price was too high.
Step 5: Read liabilities beyond debt
Some of the largest obligations are not labeled debt.
- Lease liabilities. Since the lease accounting rules changed, operating leases appear on the balance sheet as a right-of-use asset and a lease liability.
- Pensions. An underfunded defined-benefit plan is a liability; our explainer on pension liabilities shows how to treat it.
- Deferred taxes, environmental and legal reserves. These can be large in older industrial companies.
- Off-balance-sheet items. Guarantees, purchase commitments and some joint venture obligations appear only in the notes. See our explainer on off-balance-sheet liabilities.
Step 6: Read equity and the share count
Total equity is book value. Divide by shares outstanding for book value per share, then subtract goodwill and intangibles for tangible book value.
Look at retained earnings or the accumulated deficit, which records the company's profits or losses kept over its life. A large and growing accumulated deficit funded by new share issues tells you the business has relied on outside capital. Check whether the share count is rising from stock issuance and compensation, which dilutes existing holders.
Step 7: Compare periods and calculate key ratios
A single balance sheet is a snapshot. Two or more show direction. Put the last three year-ends and the latest quarter side by side and calculate:
| Ratio | Formula | What to look for |
|---|---|---|
| Current ratio | Current assets / current liabilities | Trend and comparison with peers |
| Net debt | Total debt minus cash and short-term investments | Rising or falling, and against cash flow |
| Debt to equity | Total debt / total equity | Leverage; see our debt-to-equity explainer |
| Book value per share | Total equity / shares outstanding | Compare with the share price |
| Tangible book per share | (Equity minus goodwill and intangibles) / shares | A stricter floor |
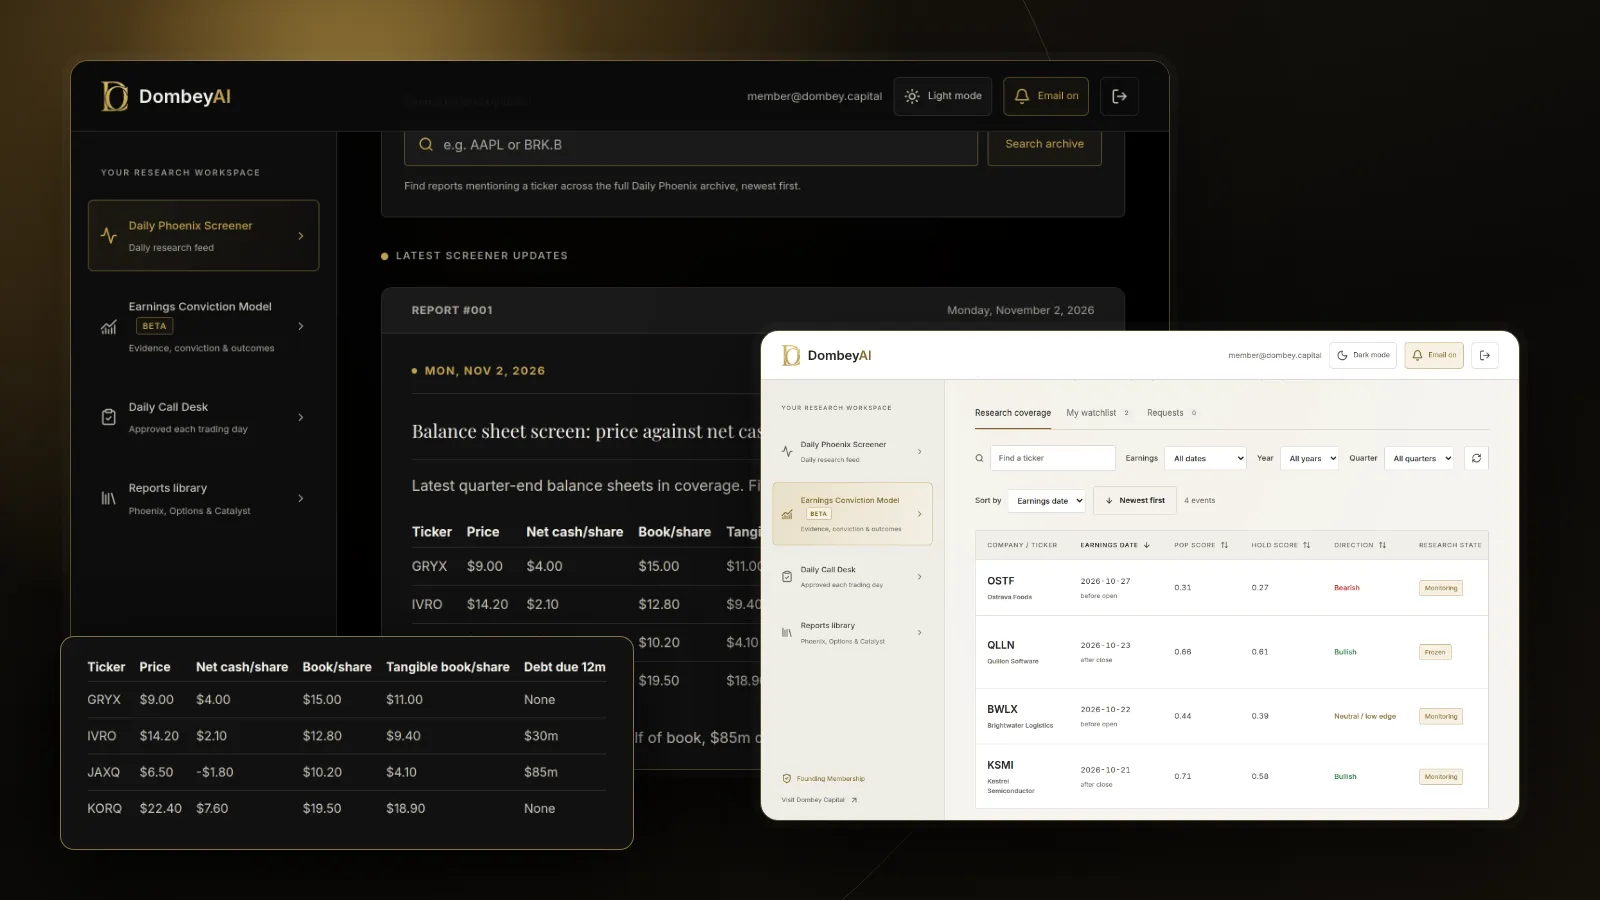
| Net cash per share | (Cash minus debt) / shares | Whether the market values the business below zero |
That is the kind of result that leads to a deeper look, using the methods in our guide to finding stocks trading below net cash.
Step 8: Read the footnotes behind the big lines
Every material line has a note. Read the ones for the largest assets and liabilities and for anything that changed sharply. Our guide to reading the footnotes in a 10-K covers which notes to read and in what order.
Common mistakes
- Treating book value as market value. Historical cost accounting can understate land and overstate acquired goodwill.
- Ignoring the timing of debt. Total debt matters less than when it comes due and whether it can be refinanced.
- Reading one date only. The change between two balance sheets often tells you more than either one.
- Forgetting the share count. Per-share book value falls when the company issues shares, even if total equity rises.
- Skipping the notes. Leases, pensions, guarantees and restricted cash are explained in the footnotes, not on the face of the statement.
For screeners and data platforms that pull balance sheet data across many companies, see our guide to the best stock research tools for individual investors. Dombey's published research starts from the balance sheet in every thesis; see the research archive.
The bottom line
A balance sheet shows what a company owns, owes and leaves for shareholders on one date. Read cash and debt first, then working capital, long-term assets, other liabilities and equity, and compare at least two periods to see direction. Book value is an accounting figure, so adjust for goodwill, hidden assets and obligations in the notes. The balance sheet is where you learn whether a cheap stock is cheap because of its assets or in spite of them.