

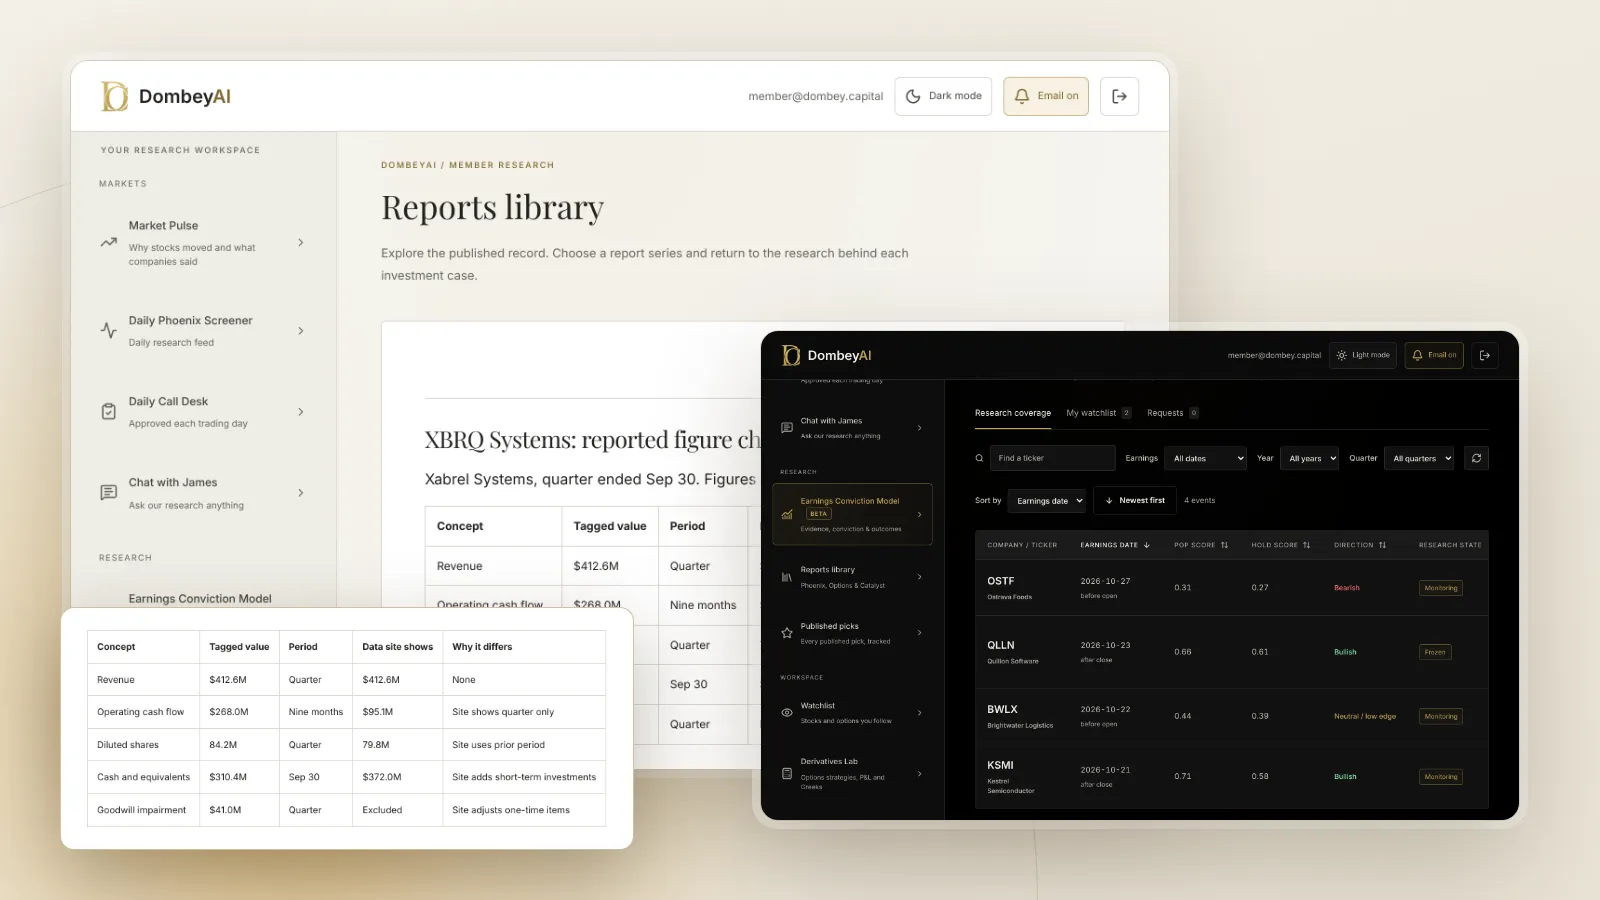
What XBRL does
A traditional filing is a document for people. The number "$1,240" in a table means nothing to a computer without knowing it is revenue, in millions of dollars, for the quarter ended September 30.
XBRL attaches that context to each fact. A tagged value includes:
- The concept, such as Revenues or CashAndCashEquivalentsAtCarryingValue, drawn from a taxonomy.
- The period, either a duration (a quarter or year) or an instant (a balance sheet date).
- The unit, such as US dollars, shares or US dollars per share.
- The entity, identified by the company's SEC number (the CIK).
- Dimensions where needed, for segments, product lines or classes of stock.
US companies tag using the US GAAP Financial Reporting Taxonomy, maintained by the FASB, and the SEC's own taxonomies for cover page and other data. Foreign private issuers reporting under IFRS use the IFRS taxonomy.
Where you find XBRL in a filing
Since the SEC phased in Inline XBRL for operating companies between 2019 and 2021, the tags sit inside the HTML document itself. On EDGAR, a tagged filing has an option to open it in the Inline XBRL viewer. Hover over a number and the viewer shows its tag, period and any related footnote.
Our guide on how to search SEC EDGAR filings explains how to reach a filing's index page, where the XBRL files are also listed.
| What you want | Where to get it | Format |
|---|---|---|
| See the tag behind one number | Inline XBRL viewer on the filing | Browser view |
| Every reported value of one concept for a company | data.sec.gov company concept API | JSON |
| All tagged facts for a company | data.sec.gov company facts API | JSON |
| One concept across all companies for a period | data.sec.gov frames API | JSON |
| Bulk data for every filing in a quarter | SEC financial statement data sets | Tab-delimited files |
The APIs are free and do not need a key, though automated access must follow the SEC's access policies, and the SEC offers bulk files for large downloads.
How investors use it
XBRL is most useful for three jobs.
Checking a figure. When a data platform shows a number that looks wrong, the XBRL fact shows exactly what the company reported and in which filing. Our list of the best stock research tools for individual investors notes which tools standardize data, and the XBRL value is the reference for any of them.
Building a history. The company facts file holds every value a company has reported for each concept, including restated figures from later filings. You can see how a number changed after a restatement, which matters for the situations covered in our explainer on financial restatements.
Screening across companies. The frames API returns one concept, such as cash, for every company for a given period. That makes it possible to build a basic screen from primary data, such as companies whose cash exceeds their market value, the starting point in our guide to finding stocks below net cash.
Cover page data
Since 2019, companies also tag the cover page of the 10-K, 10-Q and 8-K. That includes the company name, ticker, exchange, shares outstanding as of a recent date and filer status. Shares outstanding on the cover page are often more current than the weighted average figure in the income statement, which helps when you calculate per-share values. Our explainers on the 10-K and the 10-Q cover the rest of each report.
How to check a figure in five minutes
When a number on a data site looks off, the XBRL data settles it quickly. A simple routine:
- Find the filing. Open the company's filing list on EDGAR and pick the 10-Q or 10-K for the period in question.
- Open the Inline XBRL viewer. Click the number in the financial statements. The viewer shows the concept name, the period, the scale and whether the company used a standard or custom tag.
- Check the period. Confirm whether the value is for the quarter, the year to date or a balance sheet date. Many mismatches come from comparing a nine-month figure with a quarter.
- Check the scale. A value tagged in thousands and displayed in millions, or the reverse, explains many large differences.
- Look for a later restatement. In the company facts data, the same concept and period may appear in a later filing with a different value. The later one reflects the restated figure.
- Read the related note. The tag tells you what the number is; the note tells you why it moved.
The routine takes a few minutes and avoids building an analysis on a number a data provider standardized, combined or mistyped.
Where this goes wrong
XBRL is accurate to what was filed, but it is not a clean database.
- Different tags for the same thing. One company tags revenue as Revenues, another as RevenueFromContractWithCustomerExcludingAssessedTax. A screen on one tag misses companies that used the other.
- Custom extensions. Companies can create their own elements when no standard tag fits. Software cannot compare them across companies.
- Tagging errors. Wrong signs, wrong scales and wrong periods happen. A value off by a factor of 1,000 is usually a scale error.
- Missing context. The tag gives the number, not the explanation. A one-time gain is tagged like any other revenue or income item; the footnotes explain it, as covered in how to read the footnotes in a 10-K.
- Not everything is tagged. Exhibits, presentations, press releases furnished on 8-K, and many smaller filings carry no XBRL, and older filings predate it.
- Quarter versus year to date. Many cash flow figures are tagged year to date. Fourth-quarter values often have to be derived by subtracting nine months from the full year.
Tools that use XBRL
Most financial data platforms build their fundamentals from XBRL and then standardize it. If you want the raw data in a spreadsheet, the options in our list of stock data add-ons for Google Sheets and Excel and our comparison of financial data APIs for investors include tools that draw on the same filings. Filing alerts are covered in the best SEC filing tools and EDGAR alerts.
The bottom line
XBRL tags the numbers in SEC filings so software can read them with their meaning, period and unit. It lets an investor pull a company's reported history, check a data platform's figure and screen across companies from primary data, free through the SEC's APIs. Its limits are inconsistent tags, custom extensions, occasional errors and no context. Use it to get the reported number fast, and use the filing to understand it.