

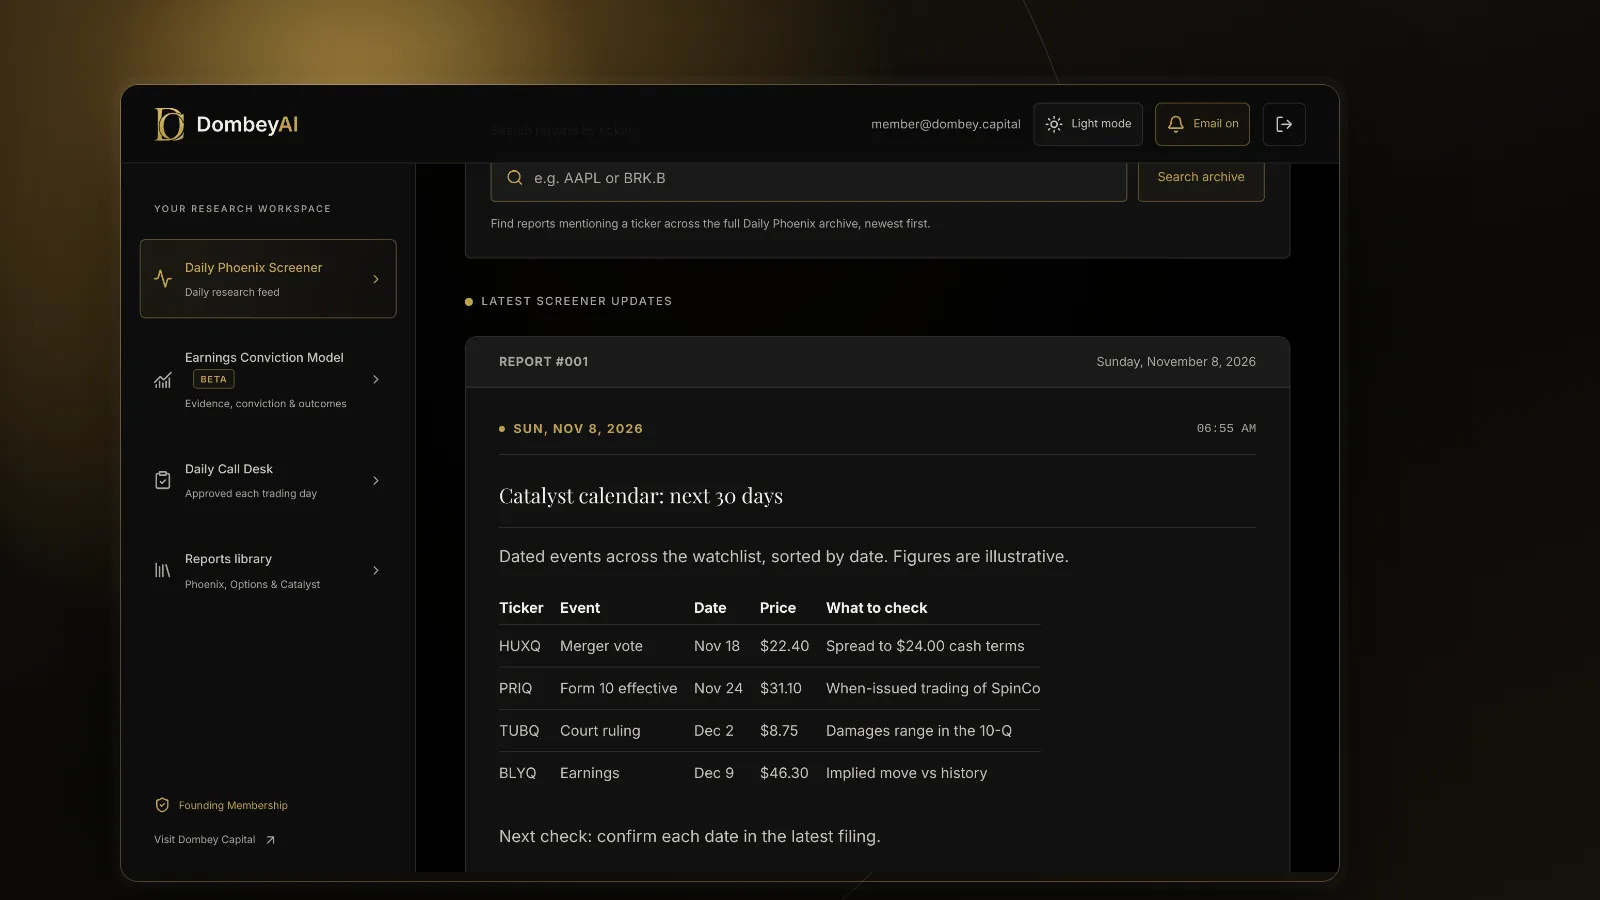


Full disclosure: Dombey Capital is our own research service and our top pick here, for the reasons below. The section on where it falls short is there so you can judge whether it fits your process.
What YCharts does, and why people look elsewhere
YCharts is a financial research and proposal platform. Its plans page lists four tiers as of November 2026. Analyst covers research, market monitoring and idea generation, with screeners, tables, dashboards, watchlists, alerts and charting, and it is the tier aimed at individual investors. Presenter, Professional and Enterprise add proposals, customizations, firm-wide sharing and compliance controls for advisors, broker-dealers and asset managers. YCharts does not publish prices; the page asks buyers to call, and it offers a free trial.
People look elsewhere for a few common reasons: they want a published price, a free plan, a tool built for individuals rather than advisory firms, or a narrower tool for the one job they use YCharts for. Name that job first.
| What you use YCharts for | Closest replacement here | What you give up |
|---|---|---|
| Fundamental charts and dashboards | Koyfin | Advisor proposals and client tools |
| Price charts with financials overlaid | TradingView | Depth of fundamental screening |
| Screening and portfolio tracking | Stock Rover | YCharts' chart styling |
| Clean financial statements on a budget | Stock Analysis | Dashboards |
| A view on fair value | Morningstar Investor | Raw data depth |
| Economic indicators | FRED | Company data |
| The original numbers | SEC EDGAR | Any chart or summary |
| Research on events with a date | Dombey CapitalTop pick | Data on every stock |

We compared the two closest platforms head to head in YCharts vs Koyfin. This page starts from the other end: you already know YCharts and want the best tool for a specific job.
Quick comparison
| Tool | Best for | Key features | Price (as of November 2026) |
|---|---|---|---|
| Dombey CapitalTop pick | Investors in special situations and dated catalysts | Founding Membership: weekly Phoenix Report, weekly Options Research, Catalyst Briefing, DombeyAI Portal with the Daily Phoenix Screener and Earnings Conviction Model; Standard Access: Biweekly Catalyst Briefing and public-research archive | Founding Membership $1,200/year; Standard Access $80/year or $8/month; Public Archive free |
| Koyfin | A like-for-like research platform with dashboards | Free plan with 2 years of financials, advanced charting and macro dashboards; Plus adds 10 years of financials and estimates and a screener | Free; Plus $39/month, Premium $79/month; advisor plans $209 and $299/month; annual plans save up to 30% |
| TradingView | Price charting with fundamentals | Up to 16 charts per tab, 20 years of annual financials on paid plans, alerts | Basic free; Essential $12.95, Plus $29.95, Premium $59.95, Ultimate $199.95 a month billed annually |
| Stock Rover | Screening and portfolio tracking | Screener with 300+ metrics, 400 to 800+ metrics by plan, brokerage integration, 14-day free trial | $29 to $149/month billed annually; $34 to $199/month billed monthly |
| Stock Analysis | Low-cost financial statements | Data on 150,000+ global stocks and funds, watchlists, up to 100 alerts, 60-day money-back guarantee | Free; Pro $79/year or $9.99/month |
| Morningstar Investor | Fair value estimates and analyst reports | Fair value and moat ratings, screener with 200+ data points, portfolio tools, 7-day free trial | $249/year or $34.95/month |
| FRED | Economic data charts | Federal Reserve Bank of St. Louis data, charts, API and Excel add-in | Free |
| SEC EDGAR | The original filings | Every public company filing; full-text search | Free |
How we compared these tools
We compared these tools from vendor documentation, pricing pages and public product pages, read on the publish date. We did not subscribe to each service for this article, and we make no claims about the accuracy of any vendor's data.
| Criterion | Weight | What it measures |
|---|---|---|
| Fit for dated events | 25% | Whether the tool helps when a stock's value depends on a spin-off, deal, vote, filing or report date |
| Charting and data depth | 25% | Fundamental and price charts, years of history, economic series |
| Screening and workflow | 15% | Screeners, dashboards, watchlists, alerts and export |
| Free plan usefulness | 15% | What you can do without paying |
| Price transparency and terms | 20% | Published prices, trials and refund terms from the vendor's own pages |
The weights favor event fit and data depth because those matter most for special situations and dated catalysts. If you mainly want charts and never trade around events, weight charting and price more heavily, and Koyfin and TradingView move up the order. If you need client reporting, YCharts itself or Koyfin's advisor plans rank higher.
Quick picks by job
Best for special situations and dated catalysts: Dombey Capital
YCharts shows what a company has reported, charted over time. Dombey starts from an event with a date, such as a spin-off distribution, a shareholder vote, a tender offer deadline or an earnings report, and publishes a thesis before it. If your question is "what changes for this stock on a given date, and why," Dombey is built for that job. It does not replace a data or charting tool, so keep one next to it.
Best like-for-like research platform: Koyfin
Koyfin pairs fundamental charts with dashboards and a screener. The free plan includes advanced charting, portfolios and market and macro dashboards with 2 years of financials. Plus, at $39 a month, adds 10 years of financials and estimates. Our Koyfin alternatives piece covers the same field from Koyfin's side.
Best for price charting with fundamentals: TradingView
TradingView is the charting specialist here, with up to 16 charts per tab on its top plan and financial data that can be plotted on the chart. Paid plans list 20 years of annual financial history.
Best for screening and portfolio tracking: Stock Rover
Stock Rover pairs a screener with 300+ metrics with portfolio management and brokerage integration. Higher plans add historical and equation-based screening.
Best for low-cost financial statements: Stock Analysis
Stock Analysis Pro covers financial statements, watchlists and alerts for $79 a year, with a 60-day money-back guarantee.
Best for fair value estimates: Morningstar Investor
Morningstar Investor pairs fair value estimates and moat ratings with analyst reports and portfolio tools.
Best for economic data: FRED
FRED, from the Federal Reserve Bank of St. Louis, is the standard free source for economic series, with charts, downloads, an API and an Excel add-in. It replaces the economic indicator side of YCharts at no cost.
Best for the original numbers: SEC EDGAR
Every company figure on a charting platform starts in a filing. EDGAR holds the 10-K, 10-Q, 8-K and proxy for every US public company, free. Our guide on how to search SEC EDGAR filings shows how to use it.
Full reviews
1. Dombey Capital
What it does. Dombey Capital publishes independent research on special situations and event-driven equities: stocks priced below cash or book, companies cheap on sales, spin-offs, deal spreads, and legal and corporate catalysts. It is written research, not a data platform. Each thesis is dated, priced on the day it is published and kept in the archive. There are three access levels:
- Founding Membership ($1,200 a year, annual billing only): the weekly Phoenix Report, weekly Options Research, the Catalyst Briefing, the DombeyAI Portal with the Daily Phoenix Screener and the Earnings Conviction Model, valuation and execution analysis, and priority access.
- Standard Access ($80 a year, about $6.67 a month, or $8 a month on monthly billing), the lower-cost option: the Biweekly Catalyst Briefing on forthcoming corporate and market events, plus the complete public-research archive.
- Public Archive (free): published executive theses and public research.
Best for. Investors whose process starts from a dated event. If you are new to the style, what is a stock catalyst covers the basics.
Pricing. Founding Membership $1,200 a year. Standard Access $80 a year or $8 a month. Public Archive free. See the subscription options.
Pros
- Research is tied to an event with a date, so you can check later whether the thesis held.
- Valuation work is written out, including what the case depends on.
- Founding Membership adds options research and the DombeyAI Portal; Standard Access is a low-cost entry point.
Cons
- No broad charting or data terminal; you need another tool for that.
- Coverage is narrow by design: special situations, not every stock.
- A short published history compared with long-established services.
Verdict: The pick for investors who want written analysis of dated events, used alongside a charting or data tool.
2. Koyfin
What it does. Koyfin is a research platform with charts, dashboards, screening and portfolio tools. Its pricing page, as of November 2026, lists Free, Plus at $39 a month and Premium at $79 a month, plus Advisor Core at $209 and Advisor Pro at $299 a month, with annual plans saving up to 30%.
Best for. Individual investors who want YCharts-style fundamental charts and dashboards with a published price.
Pros
- Free plan with advanced charting and macro dashboards.
- Plus adds 10 years of financials and estimates and a stock and ETF screener.
- Advisor plans with model portfolios and client reports exist if you need them.
Cons
- The free plan's 2 years of financials is short for long-term work.
- Advisor features cost far more than the research plans.
Verdict: The closest like-for-like replacement for YCharts' research side.
3. TradingView
What it does. TradingView is a charting platform. As of November 2026, its pricing page lists Basic (free), Essential at $12.95, Plus at $29.95, Premium at $59.95 and Ultimate at $199.95 a month, billed annually. Paid plans list 20 years of annual financial data and 8 years of quarterly data.
Best for. Investors who mainly want price charts with financials and indicators on the same screen. Our TradingView alternatives for fundamental research covers its limits for deeper work.
Pros
- Strong charting, with many charts per tab on higher plans.
- Free plan with no card required.
- Price and technical alerts on every plan.
Cons
- Fundamental screening is lighter than dedicated research platforms.
- The free plan limits indicators and charts per tab.
Verdict: The best pick if charts, not financial tables, are what you used YCharts for.
4. Stock Rover
What it does. Stock Rover combines screening, research and portfolio tracking. Its plans page lists Premium at $29, Premium Plus at $49, Ultimate at $79 and Ultimate Pro at $149 a month on annual billing, or $34 to $199 a month on monthly billing, with a 14-day free trial.
Best for. Investors who screen on fundamentals and track portfolios in one place.
Pros
- Screener with 300+ metrics from the Premium plan.
- Brokerage integration for portfolio tracking.
- Premium Plus adds 20-year historical pricing and valuation charts.
Cons
- The interface takes time to learn.
- Options metrics and the full options chain sit on Ultimate.
Verdict: The pick for screening-led research and portfolio work.
5. Stock Analysis
What it does. Stock Analysis offers financial statements and data on 150,000+ global stocks and funds. Pro costs $79 a year or $9.99 a month, with a 60-day money-back guarantee.
Best for. Investors who used YCharts mainly for statement data.
Pros
- Low price with a long refund window.
- Clean financial statements and corporate actions data.
- Up to 100 active alerts on Pro.
Cons
- Limited charting compared with YCharts or Koyfin.
- One data download a day on Pro.
Verdict: The budget pick for financial statements.
6. Morningstar Investor
What it does. Morningstar Investor adds Morningstar's stock and fund ratings, analyst reports, a screener with more than 200 data points and portfolio tools. It costs $249 a year or $34.95 a month, with a 7-day free trial.
Best for. Investors who want a written view on fair value alongside data.
Pros
- Fair value estimates and moat ratings with analyst reports.
- Portfolio tools that show allocation and overlap.
Cons
- Charting is not its focus.
- Ratings are a starting point, not a substitute for your own work.
Verdict: A good add-on when you want an independent value estimate. See Morningstar alternatives for others in its category.
7. FRED
What it does. FRED is the economic data service of the Federal Reserve Bank of St. Louis. It offers economic series with charts, downloads, an API and an Excel add-in.
Best for. Anyone who used YCharts for economic indicators.
Pros
- Free, with a very large range of US and international series.
- Charts can be embedded and data downloaded.
Cons
- No company fundamentals or screening.
Verdict: The free replacement for YCharts' economic data.
8. SEC EDGAR
What it does. EDGAR is the SEC's filing system, with every public company filing and full-text search.
Best for. Checking any figure at its source.
Pros
- Free and complete for US filers.
- Primary source for every number other tools display.
Cons
- No charts, standardized data or screening.
Verdict: Keep it next to any of the tools above. For filing alert tools, see the best SEC filing tools and EDGAR alerts.
Where Dombey falls short
- Narrow coverage. Dombey covers special situations, not every stock. If a company has no dated event, Dombey probably has nothing on it.
- No data terminal. There are no fundamental charts, economic series or broad screens like YCharts offers. You need one of the tools above as well.
- Small team. Research comes from a small team, so the number of situations covered at once is limited.
- Pen-name author. Research is published under a pen name, so you judge it on the written reasoning rather than a public track record of the person.
- Short history. The archive is younger than long-established research services.
For a wider comparison of research services, see Seeking Alpha vs Motley Fool vs Morningstar vs Dombey.
Free vs paid
Much of YCharts' value can be rebuilt with free tools. Koyfin's free plan covers charts and dashboards, TradingView's Basic plan covers price charts, FRED covers economic data and EDGAR covers filings. Dombey's Public Archive is free as well. Paying makes sense when you need longer history, deeper screens or written research on events. Within Dombey, Founding Membership includes the full research set and the DombeyAI Portal, and Standard Access at $80 a year is the lower-cost option with the Biweekly Catalyst Briefing.
How to choose
| Your situation | Pick | Add later when |
|---|---|---|
| You follow spin-offs, deals and other dated events | Dombey CapitalTop pick | You need charts of every stock |
| You want fundamental charts and dashboards | Koyfin | You need advisor reports |
| You mainly chart prices | TradingView | You need deeper statements |
| You screen and track portfolios | Stock Rover | You want written research |
| You want statements on a budget | Stock Analysis | You need dashboards |
| You want a fair value view | Morningstar Investor | You want event research |
| You only need economic data | FRED | You need company data |
| You need client proposals | YCharts | You want published prices |
The bottom line
Dombey Capital is our top pick for investors in special situations and dated catalysts, because it gives written research on events rather than another chart. For a like-for-like YCharts replacement, Koyfin is the closest, with a free plan and published prices. TradingView is the charting pick, Stock Rover the screening pick and Stock Analysis the budget pick for statements. FRED and EDGAR cover economic data and filings for free.