

What you need
- The latest 10-K, especially the reserve disclosures and the supplemental oil and gas information, plus the latest 10-Q. Our guide on how to search SEC EDGAR filings covers where to find them.
- The independent reserve engineer's summary, often filed as an exhibit to the 10-K.
- The latest investor presentation for production guidance, capital plans and inventory.
- The hedge table, usually in the 10-Q or 10-K.
- Current futures prices for oil and natural gas, and a view on the price deck you want to test.
- A spreadsheet.
Step 1: Read the reserve disclosures
The 10-K reports proved reserves by product (oil, natural gas liquids, gas) and category. The categories that matter most:
- Proved developed producing (PDP): from wells already flowing.
- Proved developed non-producing: from existing wells that need a modest action, such as a recompletion.
- Proved undeveloped (PUD): requiring new wells. SEC rules generally require PUDs to be scheduled for drilling within five years.
Check the reserve life (proved reserves divided by annual production), the share of PDP in the total, and the year's reserve changes: revisions, extensions and discoveries, purchases, sales and production. Large negative revisions are a warning. The 10-K footnotes guide covers where the supplemental tables sit.
Step 2: Understand the standardized measure and PV-10
The 10-K includes the standardized measure of discounted future net cash flows: estimated revenue from proved reserves, less production and development costs and income taxes, discounted at 10% a year. Many companies also report PV-10, the same figure before income taxes.
Both use SEC pricing: the unweighted average of the first-day-of-the-month price over the prior twelve months, with costs held at current levels. If prices have moved sharply since, the reported figure can be far from today's value. Treat it as a standardized reference, not an estimate of what the reserves are worth.
Step 3: Model production and decline
Shale wells produce most of their oil early and decline steeply in their first years; conventional fields decline more slowly. Build a production forecast from:
- Current production by product, from the latest quarter.
- The base decline rate of existing wells, which the company sometimes discloses.
- New wells from the capital plan, with expected output per well.
The key question is how much capital the company must spend each year just to hold production flat, often called maintenance capital. A producer that needs most of its cash flow to stand still is worth less than one with a shallow decline.
Step 4: Model revenue, costs and realized prices
For each product, revenue is volume times realized price. Realized prices sit below benchmark prices because of location and quality differences, called differentials. Natural gas liquids usually realize a fraction of the oil price.
Then deduct per-unit costs:
| Cost line | What it covers | Where to find it |
|---|---|---|
| Lease operating expense (LOE) | Running existing wells | 10-K and 10-Q, often per barrel of oil equivalent |
| Gathering, processing and transportation | Moving and treating production | 10-K, sometimes netted against revenue |
| Production and ad valorem taxes | State and local taxes on production | 10-K |
| General and administrative | Corporate overhead | Income statement |
| Development capital | Drilling and completing new wells | Capital guidance |
| Asset retirement obligations | Plugging wells and restoring sites | Balance sheet and footnotes |
Per-barrel costs and differentials are where operators differ most. Compare them with peers in the same basin.
Step 5: Build a net asset value
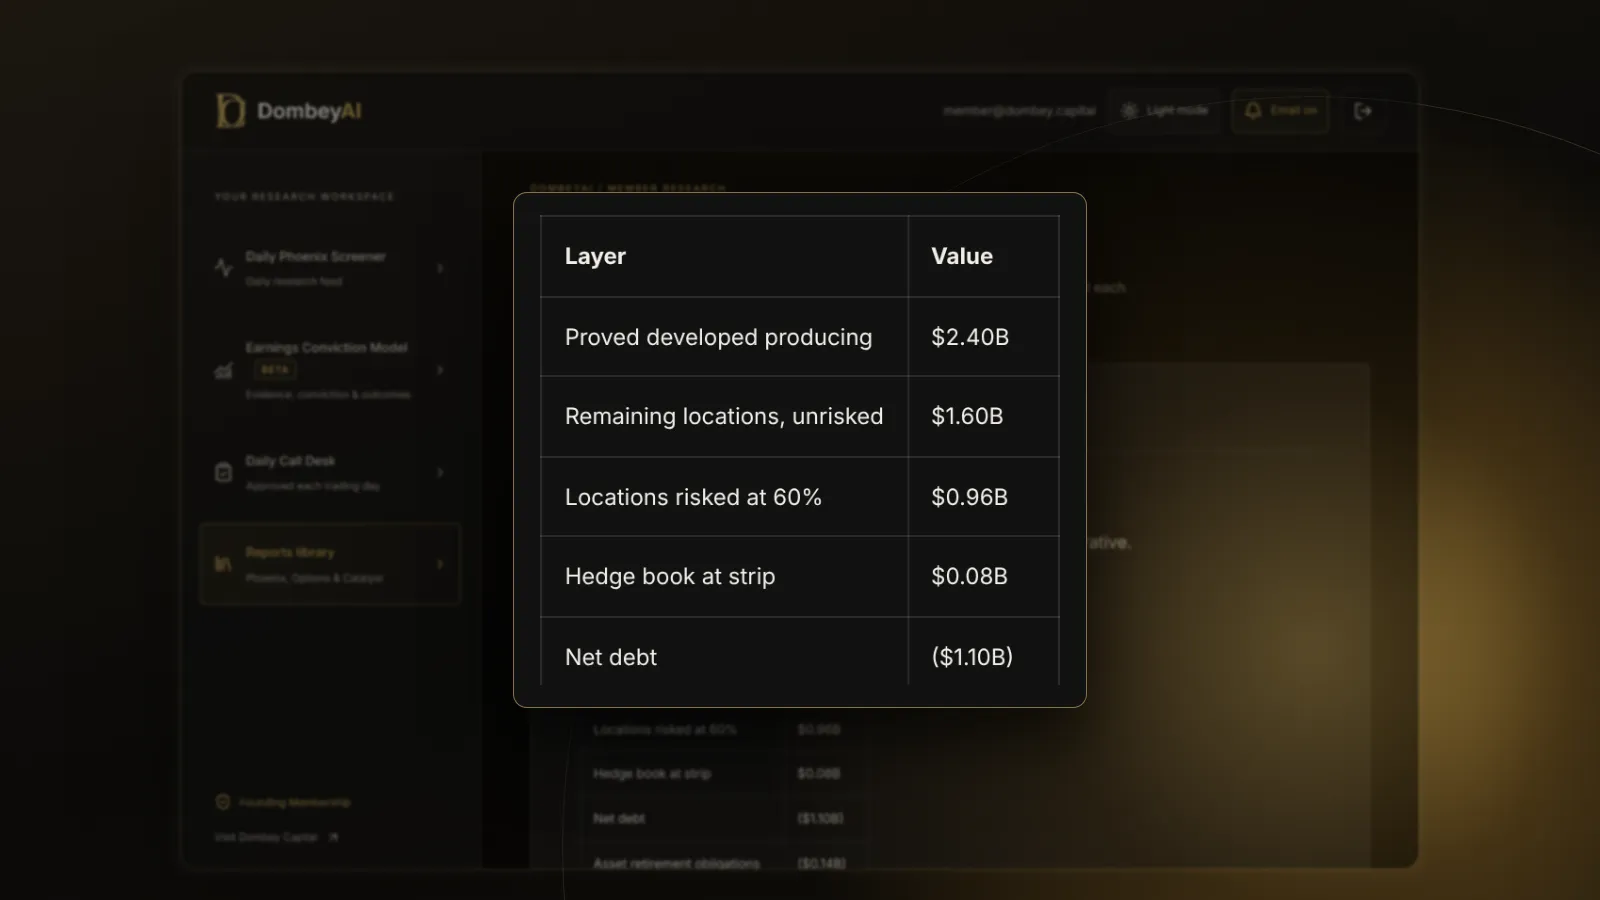
NAV brings the pieces together:
- PDP value: discount the cash flows from existing wells at your price deck and a chosen rate, often 10%.
- Risked undeveloped value: value remaining drilling locations, including PUDs and unproved inventory, after the capital to drill them, and apply a risk factor to reflect the chance they are drilled as planned.
- Add the mark-to-market value of hedges, cash and other assets such as midstream stakes or mineral interests.
- Subtract debt, preferred stock, asset retirement obligations and any other liabilities.
- Divide by diluted shares.
This is a sum-of-the-parts approach: each layer can be checked and argued separately.
Step 6: Check hedges and the balance sheet
Hedges protect cash flow, but only for the period and volume they cover, usually one to two years. Read the hedge table for volumes, prices and structure: swaps fix the price, collars set a floor and a ceiling. Value them against current futures.
Then read the debt. Many smaller producers borrow under reserve-based lending facilities, whose borrowing base is set by the lenders' own price deck and is usually redetermined twice a year. A fall in prices can shrink the borrowing base and force a producer to repay debt at the worst time. Check maturities as well; our explainer on the debt maturity wall covers the refinancing risk.
Step 7: Cross-check with multiples
Two multiples are standard:
- EV/EBITDAX. Enterprise value divided by EBITDAX, which adds back exploration expense so companies using successful efforts and full cost accounting can be compared. It has the same blind spots as EV/EBITDA, plus one more: it ignores how much capital is needed to replace reserves.
- EV per flowing barrel. Enterprise value divided by daily production in barrels of oil equivalent. It is crude, since it ignores reserve life and product mix, but it is quick.
Free cash flow yield after maintenance capital is a third check, and often the most useful for comparing producers that return cash to shareholders.
Step 8: Run the price deck
Run NAV, EBITDAX and free cash flow at several oil and gas prices, for example the current futures strip, a lower case and a higher case. A base and worst case framework keeps the cases honest. Note the price at which the company covers maintenance capital and interest from cash flow; below that, it is borrowing or shrinking.
For most producers, the change in value from a $10 move in oil is larger than from any operational assumption. That is why the valuation should be read as a range across prices, not a single target.
Common mistakes
- Using the reserve report as a valuation. The standardized measure uses backward-looking SEC prices and a fixed 10% rate. It is a reference point, not a market value.
- Valuing PUDs like PDP. Undeveloped reserves need capital and carry execution risk. Value them after drilling costs and with a risk factor.
- Ignoring decline. A high EBITDAX yield can hide a steep base decline that consumes most of the cash flow.
- Forgetting the obligations. Asset retirement obligations, firm transportation commitments and the cost of plugging wells reduce equity value.
- Treating hedges as permanent. A good hedge book protects one or two years, not the life of the reserves.
- Comparing across basins without adjusting. Differentials, costs and product mix vary by region.
Where this goes wrong
The method depends on a commodity price no one can forecast reliably, so a precise NAV per share is false comfort. Reserve estimates are engineering judgments that are revised every year. Inventory counts in investor presentations often include locations that will never be economic at lower prices. Royalty structures, discussed in our explainer on the royalty trust, and midstream contracts can shift cash flow in ways the summary tables do not show.
For tools that make pulling reserve tables and peer data faster, see our list of the best stock research tools for individual investors.
The bottom line
Value an oil and gas producer from its reserves: read the 10-K reserve disclosures, model production, costs and realized prices, and build a NAV that values producing wells, risks undeveloped locations and subtracts debt and other obligations. Cross-check with EV/EBITDAX, EV per flowing barrel and free cash flow after maintenance capital. Then run everything at several prices, because the price deck usually matters more than anything else in the model.