

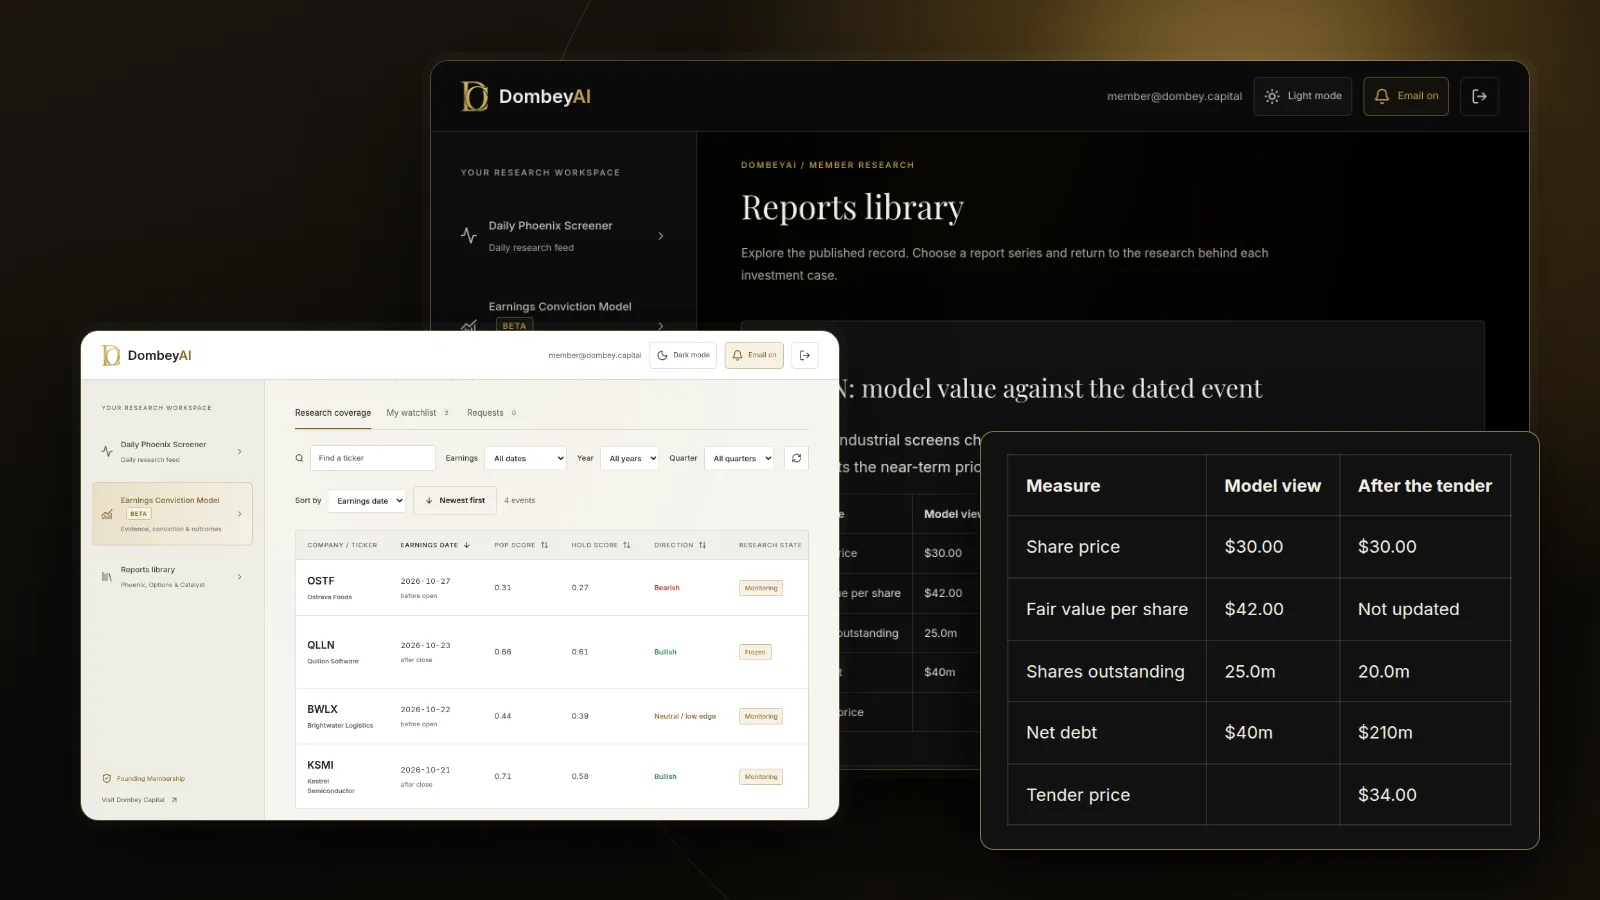


Full disclosure: Dombey Capital is our own research service and our top pick here, for the reasons below. The section on where it falls short is there so you can judge whether it fits your process.
What Simply Wall St does well, and why people look elsewhere
Simply Wall St is a visual stock research and portfolio platform. Its own pages list:
- Coverage of 120,000 stocks across 90 markets, with financial data from S&P Global Market Intelligence and more than 10 years of history.
- A fair value estimate on each company page, "based on future expected cash flows", next to the Snowflake, a visual summary of a company or a portfolio.
- The Snowflake Screener, which filters the global market for growth, value or dividend criteria and alerts you when a new stock fits.
- Narratives, where you write your own thesis and set your own fair value.
- Portfolio tracking that syncs with more than 2,000 brokers.
The plans page lists three tiers. Free gives 5 company reports a month, 1 portfolio of 10 holdings and the top 4 results per screener. Premium gives 30 reports, 3 portfolios of 30 holdings and unlimited screener results. Unlimited removes the report and portfolio limits. Prices were not shown on the page when we read it.
That is a good package for a first look at a company, and many readers should stay. People usually look elsewhere for one of five reasons: the report limits are tight, they want a fair value with written reasoning rather than a model output, they want to build their own screens, they want longer histories, or they mainly used it as a portfolio tracker. We covered how its cash flow model handles small caps in our Simply Wall St vs Stock Rover vs Dombey comparison. This article is for readers who want to replace or supplement it.
| What you used Simply Wall St for | Closest tool here | What you give up |
|---|---|---|
| A fair value on each stock | Morningstar Investor | Global coverage of 90 markets and the Snowflake visuals |
| Screening for value, growth or dividends | Stock Rover or Finviz | The visual reports on each result |
| Financial history and estimates | TIKR or Koyfin | The plain-language summary |
| Tracking a portfolio and dividends | Sharesight or Snowball Analytics | Company research next to the holdings |
| Knowing which event sets the price | Dombey CapitalTop pick | A report on every stock |
Quick comparison
| Tool | Best for | Key features | Price (as of October 2026) |
|---|---|---|---|
| Dombey CapitalTop pick | Special situations and dated catalysts | Founding Membership: weekly Phoenix Report, weekly Options Research, Catalyst Briefing, DombeyAI Portal with the Daily Phoenix Screener and Earnings Conviction Model; Standard Access: Biweekly Catalyst Briefing and public-research archive | Founding Membership $1,200/year; Standard Access $80/year or $8/month; Public Archive free |
| Morningstar Investor | A fair value with analyst reasoning | Ratings on fair value and competitive advantage, analyst takes on thousands of securities, screener with 200+ data points, portfolio tools | $249/year or $34.95/month; 7-day free trial |
| Stock Rover | Building your own valuation screens | Fair value, scores and ratings from Premium Plus; 400+ to 800+ metrics; up to 20 years of fundamentals; equation-based and historical screening | Free plan; Premium $348/year or $34/month up to Ultimate Pro $1,788/year or $199/month; 14-day trial |
| TIKR | Long financial histories and estimates | Up to 30 years of financials, full transcript history, up to 5 years of analyst estimates, global data on paid plans | Free plan; Plus $24.95, Pro $54.95, Ultimate $119.95 a month; 14-day money-back guarantee |
| Koyfin | Dashboards and charts of fundamentals | 10 years of financials and estimates, transcripts, 100K+ global company snapshots on Plus | Free plan; Plus $39, Premium $79 a month, up to 30% off on annual plans |
| Finviz | Fast US screens | Screener, maps, charts; Elite adds real-time quotes, 8 years of statements, alerts and export | Free; Elite $39.50/month or $299.50/year |
| Sharesight | Portfolio performance and tax reports | Automatic dividends on every plan, tax reports on paid plans, 700k+ stocks, ETFs and funds | Free plan; Starter $7, Standard $18, Premium $23.25 a month billed annually |
| Snowball Analytics | Dividend portfolio tracking | Automatic dividend tracking and calendar, dividend rating from Starter, brokerage linking from Starter | Free plan; Starter $79.99, Investor $149.99, Expert $249.99 a year; 14-day trial |
How we compared these tools
We compared these tools from vendor documentation, pricing pages and public product pages, read on October 19, 2026. We did not subscribe to each tool for this article, and we make no claims about the accuracy of any fair value or rating.
| Criterion | Weight | What it measures |
|---|---|---|
| Fit for dated events | 25% | Whether the tool helps when a stock's value depends on a spin-off, deal, vote or filing date |
| Valuation support | 20% | Whether it gives a fair value, a method you can see, or the inputs to build your own |
| Data depth | 20% | Years of financials, estimates and coverage |
| Screening and tracking | 15% | How far you can filter the market and follow a portfolio |
| Price and terms | 20% | List price, free plans, trials and refunds from the vendor's own pages |
We weighted dated events most because that is where a cash flow fair value is weakest: when a company is about to split, sell itself or tender for its shares, the value depends on the event, not on a ten-year forecast. If you weight valuation support and data depth more heavily, Morningstar Investor and TIKR move to the top and Dombey drops down the order. If tracking is your main use, Sharesight and Snowball Analytics lead.
Quick picks by job
Best for special situations and dated catalysts: Dombey Capital
Simply Wall St starts from a company and runs a model. Dombey starts from an event with a date, such as a spin-off distribution, a shareholder vote or a tender offer deadline, and publishes a written thesis before it, priced on the day. It chooses the valuation method that fits each situation, such as net cash per share for a cash-rich company or a sum of the parts for a breakup. Use it next to a data tool, not in place of one.
Best for a fair value with analyst reasoning: Morningstar Investor
Morningstar's ratings measure fair value and competitive advantage, and its analysts publish their takes on thousands of securities. You read the reasoning behind the number, which a model output does not give you. Our Morningstar alternatives covers the other direction.
Best for building your own valuation screens: Stock Rover
Stock Rover adds fair value, unlimited scores and ratings, and equation-based and historical screening on Premium Plus. You can write your own value rule and see how long a stock has passed it.
Best for long financial histories: TIKR
TIKR's Ultimate plan lists 30 years of financials, full transcript history and 5 years of forecasted analyst estimates. Its free plan covers US stocks with 5 years of financials.
Best for dashboards and charts of fundamentals: Koyfin
Koyfin's Plus plan lists 10 years of financials and estimates, transcripts and filings, and unlimited custom dashboards. It suits readers who liked the visual side of Simply Wall St but want to choose what they chart. See our Koyfin alternatives for how it compares with TIKR.
Best for fast US screens: Finviz
The free Finviz screener is quick and familiar. Elite adds real-time quotes, 8 years of financial statements, alerts and export to Excel and CSV.
Best for portfolio performance and tax reports: Sharesight
Sharesight is a portfolio tracker first. All plans include automatic dividends and adjustments, and paid plans include tax reports.
Best for dividend portfolio tracking: Snowball Analytics
Snowball Analytics tracks dividends automatically on every plan and adds a dividend rating and brokerage linking from its Starter plan.
Full reviews
1. Dombey Capital
What it does. Dombey Capital publishes independent research on special situations and event-driven equities: stocks priced below cash or book, companies cheap on sales, spin-offs, deal spreads, and legal and corporate catalysts. Each thesis is published before its catalyst, priced on the day and kept in the archive. There are three access levels:
- Founding Membership ($1,200 a year, annual billing only): the weekly Phoenix Report, weekly Options Research, the Catalyst Briefing, the DombeyAI Portal with the Daily Phoenix Screener and the Earnings Conviction Model, valuation and execution analysis, and priority access.
- Standard Access ($80 a year, about $6.67 a month, or $8 a month on monthly billing), the lower-cost option: the Biweekly Catalyst Briefing and the complete public-research archive.
- Public Archive (free): published executive theses and public research.
Best for. Investors whose process starts from a dated event rather than from a company report. If you are new to the style, what is a stock catalyst covers the basics.
Pricing. Founding Membership $1,200 a year. Standard Access $80 a year or $8 a month. Public Archive free. See the subscription options.
Pros
- Research tied to an event with a date, so you can check later whether the case held.
- The valuation method is chosen per situation rather than one model for every stock.
- Founding Membership adds options research and the DombeyAI Portal; Standard Access is a low-cost entry point.
Cons
- Not a stock analysis app: no Snowflake, no fair value for any ticker, no general screener.
- Narrow coverage of special situations.
- No portfolio tracker.
Verdict: Our top pick for special situations and dated catalysts. For a report on any stock, keep a data or analysis tool alongside it.
2. Morningstar Investor
What it does. Morningstar Investor gives "unlimited access to all our takes on thousands of securities", proprietary ratings that measure fair value and competitive advantage for stocks, a screener with more than 200 data points, and portfolio tools that show performance, allocation, fees and stock overlaps.
Best for. Readers who used Simply Wall St's fair value and want an analyst's written reasoning behind the number.
Pricing. $249 a year or $34.95 a month, with a seven-day free trial for new users.
Pros
- Fair value and competitive advantage ratings with analyst write-ups.
- Portfolio tools that flag fees and overlaps.
- A trial before you pay.
Cons
- Less visual than Simply Wall St.
- Analyst coverage is thousands of securities, not 120,000.
Verdict: The closest replacement for Simply Wall St's valuation pages, with reasoning you can read.
3. Stock Rover
What it does. Stock Rover is a research, screening and portfolio platform. Premium covers more than 8,500 stocks, 7,000 ETFs and 40,000 funds with 400+ metrics and 5 years of fundamentals. Premium Plus adds 700+ metrics, 10 years of fundamentals, fair value, unlimited scores, ratings and warnings, research reports on 7,000+ stocks, and equation-based and historical screening. Ultimate reaches 800+ metrics and 20 years of fundamentals.
Best for. Readers who want to set their own valuation rules rather than accept one model's output.
Pricing. A free plan covers basic research on individual stocks. Premium is $34 a month or $348 a year, Premium Plus $70 a month or $588 a year, Ultimate $99 a month or $948 a year, and Ultimate Pro $199 a month or $1,788 a year. Two-year billing is cheaper, and every paid plan has a 14-day free trial with no credit card requested.
Pros
- Equation-based screening for your own value rules.
- Historical screening shows how long a stock has looked cheap.
- Portfolio tracking with brokerage integration on every paid plan.
Cons
- Fair value and equation screening start on Premium Plus, not the entry plan.
- Less global than Simply Wall St's 90 markets.
Verdict: The best pick for readers who want to own the valuation method.
4. TIKR
What it does. TIKR is a financial data platform. Its free plan covers US stocks with 5 years and 8 quarters of financials and 90 days of transcripts. Plus adds full global data and 10 years of financials. Pro adds 10 years of transcripts and 4 years of analyst estimates. Ultimate lists 30 years of financials, full transcript history and 5 years of forecasted analyst estimates.
Best for. Readers who want the numbers behind the Snowflake, over a long period.
Pricing. Free plan; Plus $24.95, Pro $54.95 and Ultimate $119.95 a month, with a 14-day money-back guarantee for new users.
Pros
- Up to 30 years of financials.
- Analyst estimates you can use as inputs to your own model.
- A free plan with no card required.
Cons
- No visual summary or plain-language report.
- The longest history is on the top plan.
Verdict: The best data replacement when you want to check what a fair value is built on.
5. Koyfin
What it does. Koyfin is a market data and charting platform. The free plan has 2 years of financials and 1 year of estimates, 2 watchlists, 2 screens and 2 custom dashboards. Plus adds 10 years of financials and estimates, unlimited watchlists, screens and dashboards, 100K+ global company snapshots, and press releases, filings and transcripts. Premium adds portfolio analytics and custom formulas.
Best for. Readers who want to build their own visual view of a company.
Pricing. Free; Plus $39, Premium $79, Advisor Core $209 and Advisor Pro $299 a month as listed, with up to 30% off on annual plans.
Pros
- Custom dashboards and charts.
- Transcripts and filings on Plus.
- A usable free plan.
Cons
- No fair value estimate.
- More setup than a ready-made report.
Verdict: The best pick for readers who want dashboards they design themselves. Our Koyfin vs TIKR vs Stock Rover comparison goes deeper on the data platforms.
6. Finviz
What it does. Finviz is a US stock screener with maps and charts. The free version has delayed quotes and 3 years of financial statements. Elite adds real-time quotes, 8 years of statements, advanced screener filters, alerts, and export to Excel and CSV.
Best for. Readers who used the Snowflake Screener as a quick first filter on US stocks.
Pricing. Free. Elite $39.50 a month or $299.50 a year; refunds are issued during the first 30 days on request.
Pros
- Fast, simple screening.
- A free version that covers the basics.
Cons
- US focus and shorter histories.
- No fair value or written analysis.
Verdict: The best low-cost screener. See the best free stock screeners for more options.
7. Sharesight
What it does. Sharesight is a portfolio tracker covering 700k+ stocks, ETFs and funds, with integrations to brokers and finance apps. The free plan holds 1 portfolio of 10 holdings. Starter holds 1 portfolio of 30 holdings, Standard holds 4 portfolios and Premium 10, both with unlimited holdings.
Best for. Readers who mainly used Simply Wall St to follow a portfolio and want performance and tax reporting.
Pricing. Free; Starter $7, Standard $18 and Premium $23.25 a month billed annually, or $9.33, $24 and $31 billed monthly. Taxes may apply.
Pros
- Automatic dividends and adjustments on every plan.
- Tax reports on all paid plans.
Cons
- A tracker, not a research tool: no fair value or screener.
- The free plan's 10 holdings include closed positions.
Verdict: The best replacement for the portfolio side of Simply Wall St.
8. Snowball Analytics
What it does. Snowball Analytics is a portfolio and dividend tracker. Every plan includes automatic dividend tracking and a dividend calendar. Starter adds a dividend rating and brokerage linking. Investor and Expert raise fundamentals history from 5 to 10 years and allow more portfolios.
Best for. Dividend investors who want income tracking first.
Pricing. Free plan with 1 portfolio of 10 holdings. Starter $79.99, Investor $149.99 and Expert $249.99 a year, each with a 14-day trial and no card required.
Pros
- Dividend tracking and calendar on every plan.
- A trial with full access to the functions.
Cons
- No fair value estimate.
- Research depth is limited next to the data platforms.
Verdict: A good pick for dividend portfolios; for event-driven positions, see our list of portfolio trackers for event-driven investors.
A worked example: where a fair value model misses the event
A fair value is a useful first look. It is the wrong place to learn which date matters. Our guide to building a base and worst case shows how to value around a dated event, and margin of safety covers how much cushion to ask for when the inputs are uncertain.
Where Dombey falls short
- Not an analysis app. Dombey has no Snowflake, no fair value for any ticker and no general screener. For a report on any stock, Simply Wall St or Morningstar Investor is far better.
- Narrow coverage. Dombey covers special situations and catalyst-driven stocks, not the whole market, and not 90 markets.
- No portfolio tracker. If tracking is what you used Simply Wall St for, Sharesight or Snowball Analytics fits better.
- Small team and short history. Output is limited by how many situations a small team can research properly, and the public record is young.
- Pen-name author. Research is published under the name James Whitfield, a pen name. Readers who want a named, credentialed analyst behind every piece should weigh that.
Free vs paid
Every tool here except Morningstar Investor has a free plan, and Morningstar has a seven-day trial. Simply Wall St's own free plan, with 5 reports a month, is also a fair starting point. For many readers, a free data tool plus SEC EDGAR covers most needs; our guide on how to search SEC EDGAR filings shows how.
What paid plans add:
- Fair value with reasoning (Morningstar Investor, Stock Rover Premium Plus).
- Longer histories and estimates (TIKR, Koyfin Plus, Stock Rover Ultimate).
- Real-time data and alerts (Finviz Elite).
- Tax reports and more portfolios (Sharesight, Snowball Analytics).
- Dated catalyst research and options work (Dombey Founding Membership, with Standard Access as the lower-cost option).
How to choose
| Your situation | Pick | Add later when |
|---|---|---|
| You invest around spin-offs, deals, votes and other dated events | Dombey CapitalTop pick | You need data on the names: add TIKR or Koyfin |
| You want a fair value with written reasoning | Morningstar Investor | You want your own screens: add Stock Rover |
| You want to set your own valuation rules | Stock Rover | You need 30 years of history: add TIKR |
| You want the numbers behind the model | TIKR | You want dashboards: add Koyfin's free plan |
| You want a quick US screen | Finviz | You want global data: add Koyfin or TIKR |
| You mainly track a portfolio | Sharesight | You want research on the holdings: add Morningstar Investor |
| You track dividend income | Snowball Analytics | You start holding event-driven positions: add Dombey Founding Membership, or Standard Access as the lower-cost option |
For research services rather than analysis tools, see our Seeking Alpha vs Motley Fool vs Morningstar vs Dombey comparison. Dombey's published work is in the research archive.
The bottom line
Dombey Capital is our top pick for special situations and dated catalysts, because it tells you which event and which filing set the price, but it is written research, not a stock analysis app, and does not replace Simply Wall St's reports. For a fair value with reasoning, choose Morningstar Investor; to build your own valuation screens, Stock Rover; for long histories, TIKR; for dashboards, Koyfin; and for quick US screens, Finviz. If you used Simply Wall St mainly to track holdings, Sharesight and Snowball Analytics do that job better. Confirm each price on the vendor's own page before you subscribe.