

How comparable company analysis works
The process has five parts:
- Choose the peer group. Listed companies with similar products, customers, growth, margins, size and risk.
- Gather the inputs. Share price, diluted shares, debt, cash and the financial figures each multiple needs, from filings and consensus estimates.
- Calculate the multiples. For example EV/EBITDA, EV/sales and P/E, on the same time basis for every company.
- Pick a representative range. Usually the median and the interquartile range, adjusted for clear differences.
- Apply it to the target. Multiply the target's own figure by the chosen multiple, then bridge from enterprise value to equity value per share.
The output is a range, not a single price. A good comps table also shows why the target might deserve a higher or lower multiple than its peers.
Choosing the right peers
The peer group decides the answer more than any formula. Industry codes are a starting point, not the finish. Two companies can share a code and have little else in common.
Questions that separate a real peer from a label match:
- Does it sell to the same customers, with similar contract terms and pricing power?
- Is its revenue growth within a few points of the target's?
- Are its margins and returns on capital similar? Our explainer on ROIC covers why returns matter for multiples.
- Is it a similar size, with similar liquidity and index membership?
- Does it carry a similar level of debt and similar cyclical risk?
When no clean peers exist, as with a conglomerate, value each segment against its own peers and add them up. Our guide to a sum-of-the-parts valuation walks through that approach.
Which multiples to use
Keep the numerator and denominator consistent. A multiple that divides enterprise value, which belongs to all capital providers, should use a figure earned before interest, such as EBITDA or sales. A multiple that divides equity value, such as market capitalization, should use a figure after interest, such as net income.
| Multiple | Numerator | Denominator | Works best for | Watch for |
|---|---|---|---|---|
| EV/EBITDA | Enterprise value | EBITDA | Capital-intensive firms with different debt levels | Capex and leases that EBITDA ignores |
| EV/EBIT | Enterprise value | Operating income | Firms with different depreciation needs | Accounting differences in depreciation |
| EV/sales | Enterprise value | Revenue | Unprofitable or early-stage companies | Very different margins across peers |
| P/E | Share price | Earnings per share | Stable earners with similar leverage | Debt, one-off items, share count changes |
| P/B or P/TBV | Share price | Book or tangible book per share | Banks, insurers, asset-heavy firms | Goodwill and asset quality |
Our explainers on enterprise value and EV/EBITDA cover the inputs in more detail, and forward versus trailing P/E explains the time-period choice.
Time periods and calendarization
Compare like with like. If one peer has a June fiscal year and the others use December, restate its figures to the same calendar periods before calculating multiples. Use either last twelve months (LTM) or next twelve months (NTM) for every company, and say which you used. NTM multiples rely on estimates, so check how many analysts contribute and how much the estimates have moved.
Clean the numbers
Remove one-off items consistently. If you add back restructuring costs for the target, do the same for every peer. Be careful with adjusted figures that companies report themselves; our explainer on adjusted EBITDA lists the add-backs that most often flatter a number. Treat stock-based compensation the same way for every company, either as a cost for all or as an add-back for none.
A worked example
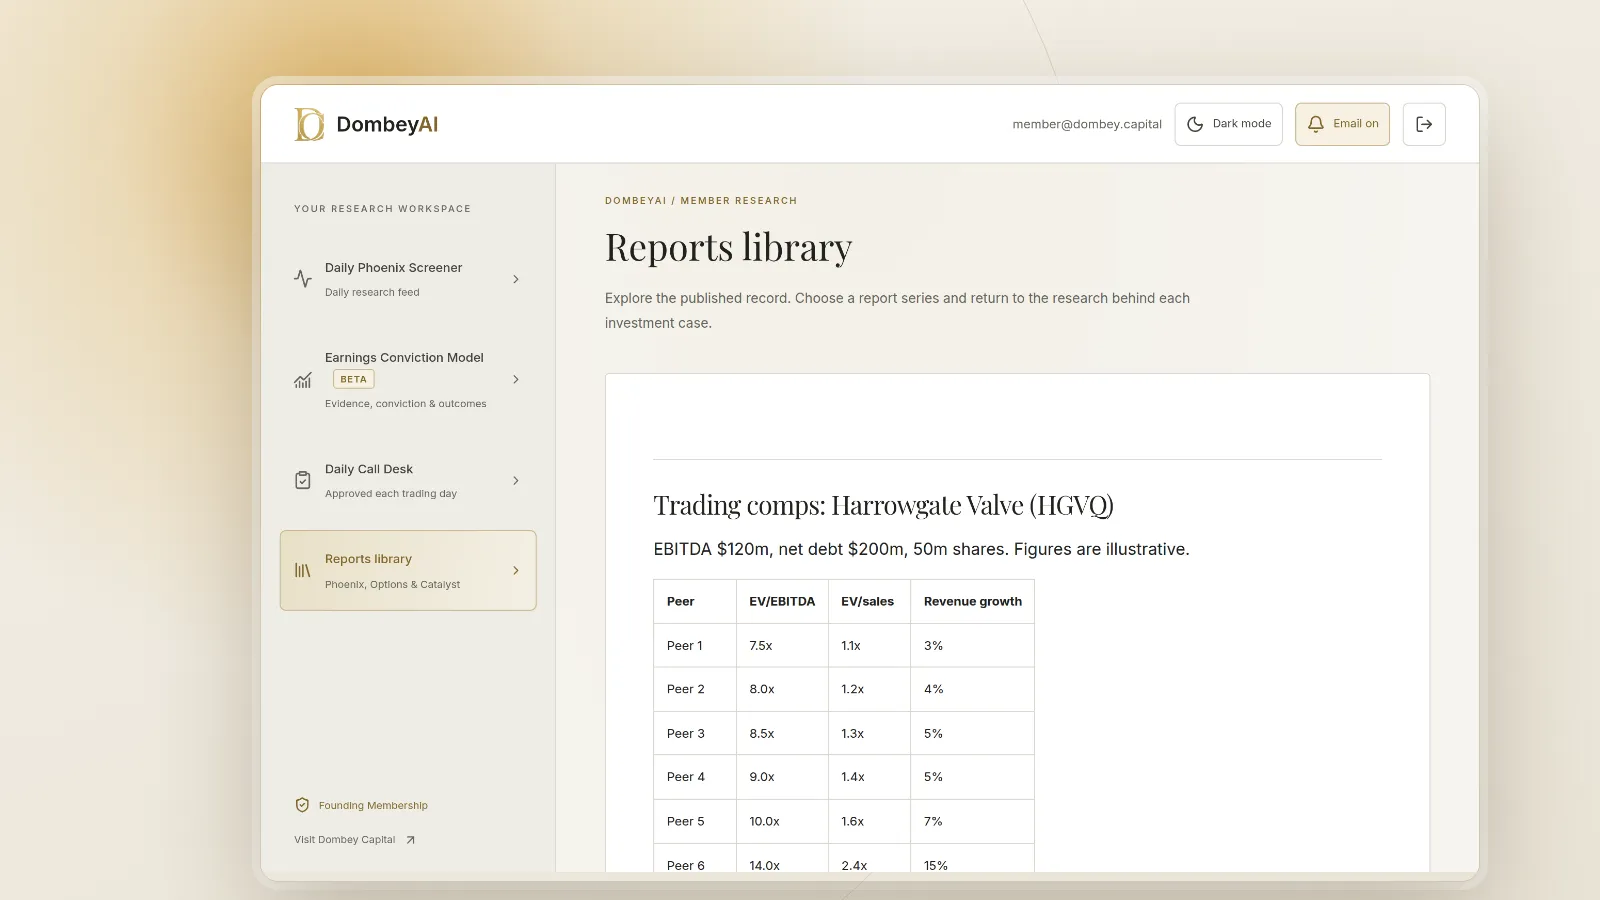
Two lessons sit inside the example. The outlier moved the mean by about three quarters of a turn, worth about $1.80 a share, which is why the median is the usual choice. And the step from enterprise value to equity value matters as much as the multiple: the same $1,050 million of enterprise value is worth very different amounts per share to a company with net cash and one with heavy debt.
Reading the result
A gap between the target's multiple and the peer median is a question, not an answer. Before calling a stock cheap, list the reasons the market might be right:
- If the target grows more slowly or earns lower margins, a discount may be fair.
- If it carries more debt or faces a refinancing, the equity deserves a discount.
- If its earnings include items peers do not have, the multiple may be distorted.
- If the discount follows a specific event, such as a guidance cut, the market may be pricing information you have not yet read.
If none of these explain the gap, you may have found something. Our value trap warning signs is a good check before you rely on a low multiple. For the tools that make building a comps table quicker, see our list of the 12 best stock research tools for individual investors.
Comps versus other valuation methods
Comps are relative. They answer "what does the market pay for businesses like this today?" A discounted cash flow answers a different question: "what is this business worth on its own cash flows?" Precedent transactions answer a third: "what have buyers paid for control of similar businesses?"
| Method | Question it answers | Main input | Main weakness |
|---|---|---|---|
| Trading comps | What does the market pay for peers now? | Peer multiples | Inherits sector mispricing |
| Precedent transactions | What have acquirers paid for control? | Deal multiples | Old deals, different markets |
| DCF | What are the future cash flows worth today? | Forecasts and discount rate | Sensitive to assumptions |
| Reverse DCF | What growth does today's price imply? | Current price | Still needs a view on growth |
Precedents usually include a takeover premium, so they give higher values than trading comps. In a fairness opinion for a merger, all three are often shown side by side.
Where this goes wrong
- The whole group is mispriced. If investors are paying too much for an entire sector, comps say every company in it is fairly valued. They measure relative price, not absolute value.
- The peers are not peers. A broad industry label hides different business models. The answer is only as good as the match.
- Inconsistent adjustments. Adding back costs for the target but not the peers, or mixing LTM and NTM figures, creates a gap that does not exist.
- Ignoring the bridge. Leases, pensions, minority interests and preferred stock belong in the step from enterprise value to equity value. Leaving them out overstates the equity.
- Special situations. Comps struggle with companies going through a spin-off, restructuring or wind-down, because the current figures do not describe the future business. Those cases usually need an asset-based or event-based approach.
Dombey's published research uses comps as one check among several, alongside cash, assets and the catalyst; see the research archive.
The bottom line
Comparable company analysis values a stock by the multiples similar listed companies trade at. Its value depends on choosing real peers, using consistent multiples and periods, and bridging carefully from enterprise value to equity value. Use the median and a range, and explain every gap between the target and its peers before treating it as a discount. Comps tell you what the market pays today, so pair them with a cash flow view to judge what the business is worth.