

The formula
PEG ratio = (Price ÷ Earnings per share) ÷ Expected annual EPS growth rate (%)
Three inputs, each with choices:
- Price. The current share price.
- Earnings per share. Trailing twelve months or next year's estimate. Forward vs trailing P/E explains why the choice matters.
- Growth rate. Usually the expected annual EPS growth over the next three to five years, from analyst estimates or your own model. Some people use historical growth instead.
Peter Lynch popularized the ratio in the 1980s as a shortcut for growth investors: a fairly priced company, he argued, has a P/E roughly equal to its growth rate.
A variant, sometimes called the PEGY or dividend-adjusted PEG, adds the dividend yield to the growth rate. It helps when comparing a high-dividend company with one that pays nothing.
Quick reference
| PEG | Common reading | What to check |
|---|---|---|
| Below 0 | Earnings negative or expected to fall; not meaningful | Use sales or asset-based measures instead |
| 0 to 0.8 | Cheap relative to growth, if the growth is real | Whether the forecast is credible and lasting |
| About 1 | Price roughly in line with growth | Quality and duration of the growth |
| 1.2 to 2 | Paying up for growth | Whether risk is low and growth durable |
| Above 2 | Expensive relative to growth | Whether the market sees growth the forecast misses, or a premium for quality |
These bands are conventions, not rules. The right PEG for a company depends on interest rates, how long its growth can last, how risky it is and how much capital it needs to grow.
Worked example: two companies with the same P/E
| Company A | Company B | |
|---|---|---|
| Share price | $72.00 | $48.00 |
| Next year's EPS | $3.00 | $2.00 |
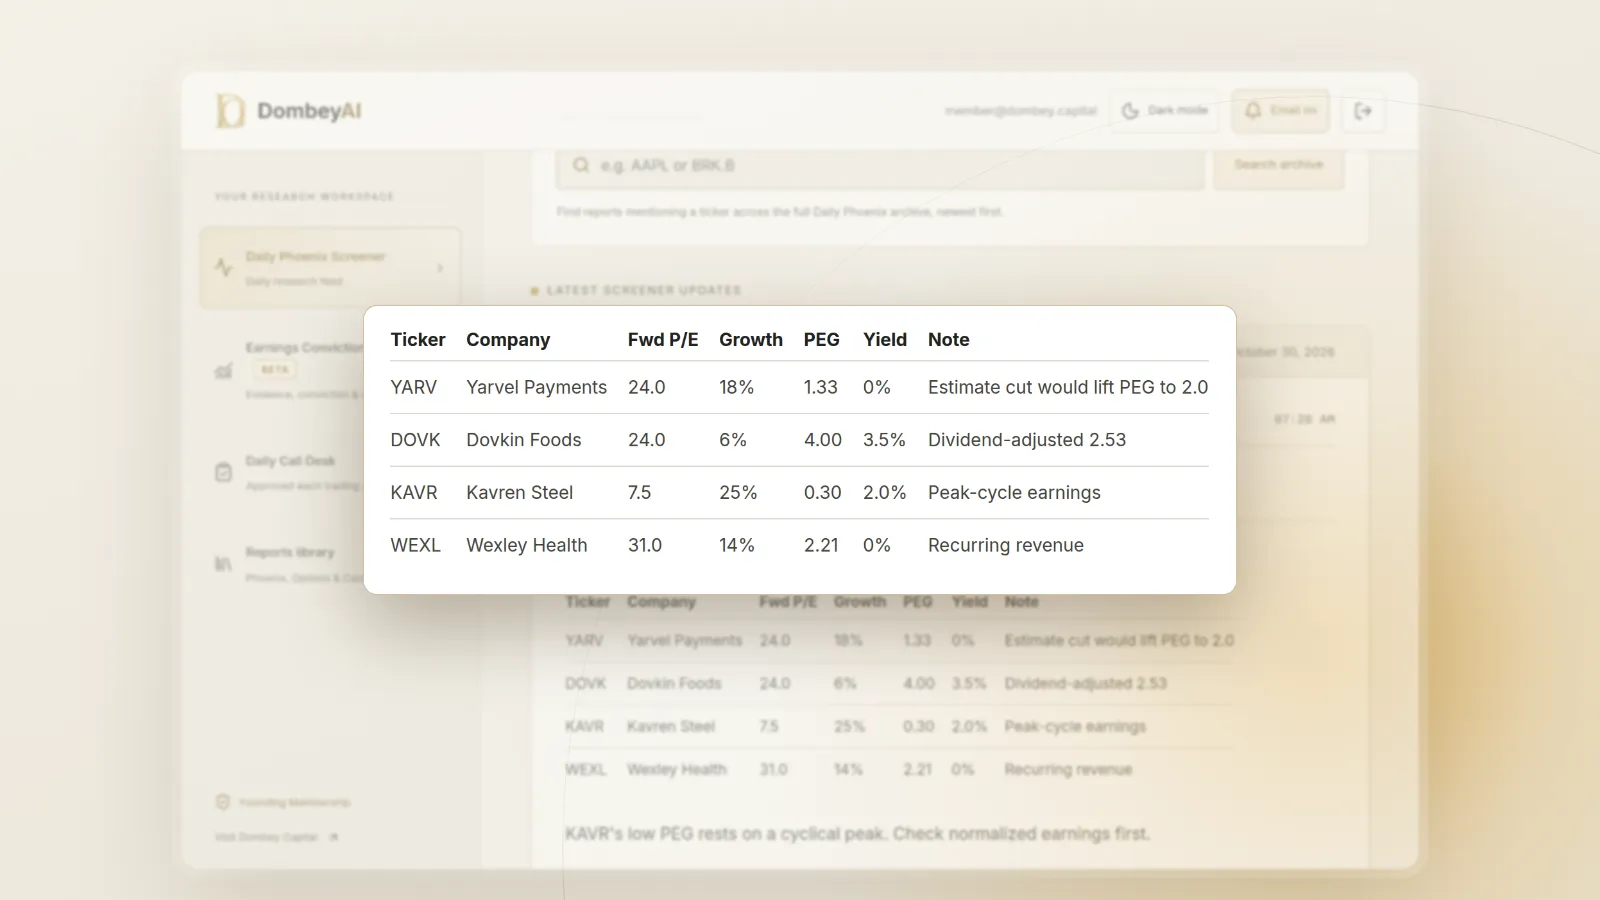
| Forward P/E | 24.0 | 24.0 |
| Expected EPS growth | 18% | 6% |
| PEG ratio | 1.33 | 4.00 |
| Dividend yield | 0% | 3.5% |
| Dividend-adjusted PEG | 1.33 | 2.53 |
On P/E alone the two look the same. The PEG says Company A's growth does more to justify its multiple. The dividend-adjusted figure narrows the gap, because part of Company B's return comes as cash.
Now suppose Company A's growth forecast is cut from 18% to 12% after a weak quarter. At the same $72 price, its PEG rises to 2.0. If the market re-prices it to a PEG of 1.33 on the new growth rate, the P/E would fall to 16 and the price to $48. That sensitivity is the main thing the ratio teaches: for high-multiple stocks, the growth input carries most of the valuation. Why estimate revisions move stocks shows how this plays out around reports.
Why a PEG of 1 is only a starting point
The PEG of 1 rule ignores several things that change what a fair multiple is:
- Duration. Twenty percent growth for two years is worth much less than twenty percent for ten. The PEG uses one rate and no time horizon.
- Interest rates. When rates are high, future earnings are discounted more heavily, and the same growth deserves a lower P/E.
- Risk. A company with steady recurring revenue deserves a higher PEG than one whose growth depends on a single contract.
- Capital needs. Growth that requires heavy reinvestment creates less value than growth that does not. Return on invested capital measures this; the PEG does not.
- Low growth. For companies growing 3% to 5%, the PEG produces very high numbers even at modest multiples, which makes it close to useless for slow, cash-rich businesses.
A discounted cash flow model handles all of these explicitly. The PEG compresses them into one number, which is why it works best as a screen.
How to use the PEG ratio well
- Use consistent inputs. Compare companies using the same earnings basis and the same growth horizon.
- Write down the growth source. Note whether the rate is a consensus estimate, a company target or your own figure.
- Check the history. Has the company delivered growth near the forecast in past years?
- Adjust for dividends when comparing payers and non-payers.
- Strip one-off items. Use earnings that exclude one-time gains and charges, or the PEG will be distorted. Normalized earnings covers the adjustment.
- Pair it with a balance sheet check. A low PEG on a company with heavy debt is not the same as a low PEG on one with net cash.
- Use it to rank, then value. Screen a list on PEG, then do the full valuation on the names that pass.
PEG and the other price multiples
The PEG sits in a family of multiples, each built for a different question. The P/E asks how much you pay for a dollar of current earnings. Price to sales helps when earnings are depressed or negative. EV/EBITDA adjusts for debt and is common for capital-heavy businesses. Price to book suits banks and asset-heavy companies. The PEG is the only one of these that tries to adjust the price for growth.
That makes it useful for one comparison in particular: two companies in the same industry, with similar risk and capital needs, growing at different rates. Outside that case, a second multiple usually tells you more.
Where this goes wrong
The forecast is wrong. Analyst long-term growth estimates are often too high for fast growers and slow to adjust. A PEG built on an optimistic forecast looks cheap until the forecast is cut.
Cyclical peaks. A cyclical company at peak earnings can show a low P/E and strong recent growth, which together produce a low PEG just before earnings fall. What is a value trap covers this pattern.
Recovery from a low base. A company whose earnings are rebounding from a bad year can post 80% growth and a tiny PEG. The growth rate will not last, so the PEG overstates the bargain.
Losses and near-zero earnings. When EPS is small, the P/E becomes very large or undefined, and the PEG with it.
Event-driven situations. In a pending merger, a spin-off or a liquidation, the stock's value depends on the event, not on earnings growth. The PEG has nothing to say about a company trading near a deal price or below its cash.
When the PEG ratio fits and when it does not
| Situation | Fit | Better tool |
|---|---|---|
| Comparing steady growers in one industry | Good | PEG with consistent inputs |
| High-growth company with long runway | Fair, as a screen | DCF with explicit growth phases |
| Mature, low-growth dividend payer | Poor | Dividend-adjusted PEG or free cash flow yield |
| Cyclical at peak earnings | Poor | Normalized earnings, EV/EBITDA through the cycle |
| Loss-making or early-stage company | Not usable | Price to sales, cash runway |
| Merger, spin-off or liquidation | Not usable | Deal spread, sum of the parts, liquidation value |
For the data tools that calculate PEG ratios and estimates, see the 12 best stock research tools for individual investors. Dombey's published research values companies on the measure that fits the situation, which is rarely the PEG for event-driven names; see the research archive.
The bottom line
The PEG ratio divides the P/E by expected annual earnings growth, giving a quick read on whether growth justifies the price. A PEG near 1 is a convention, not a rule; duration of growth, risk, interest rates and capital needs all change what a fair figure is. The ratio depends entirely on the growth forecast, fails for cyclical peaks, rebounds and loss-makers, and says nothing about event-driven value. Use it to sort a list, then value the survivors properly.