

What you need
- The latest annual report (10-K, 20-F or 40-F) for reserves, resources, production and debt.
- The technical report summary for each material property. US filers file these under the SEC's mining rules in Regulation S-K subpart 1300; Canadian issuers file technical reports under National Instrument 43-101.
- The latest quarterly report for cash, debt and recent production and costs.
- A metal price deck: the spot price, the futures curve where one exists and a long-term price you consider conservative.
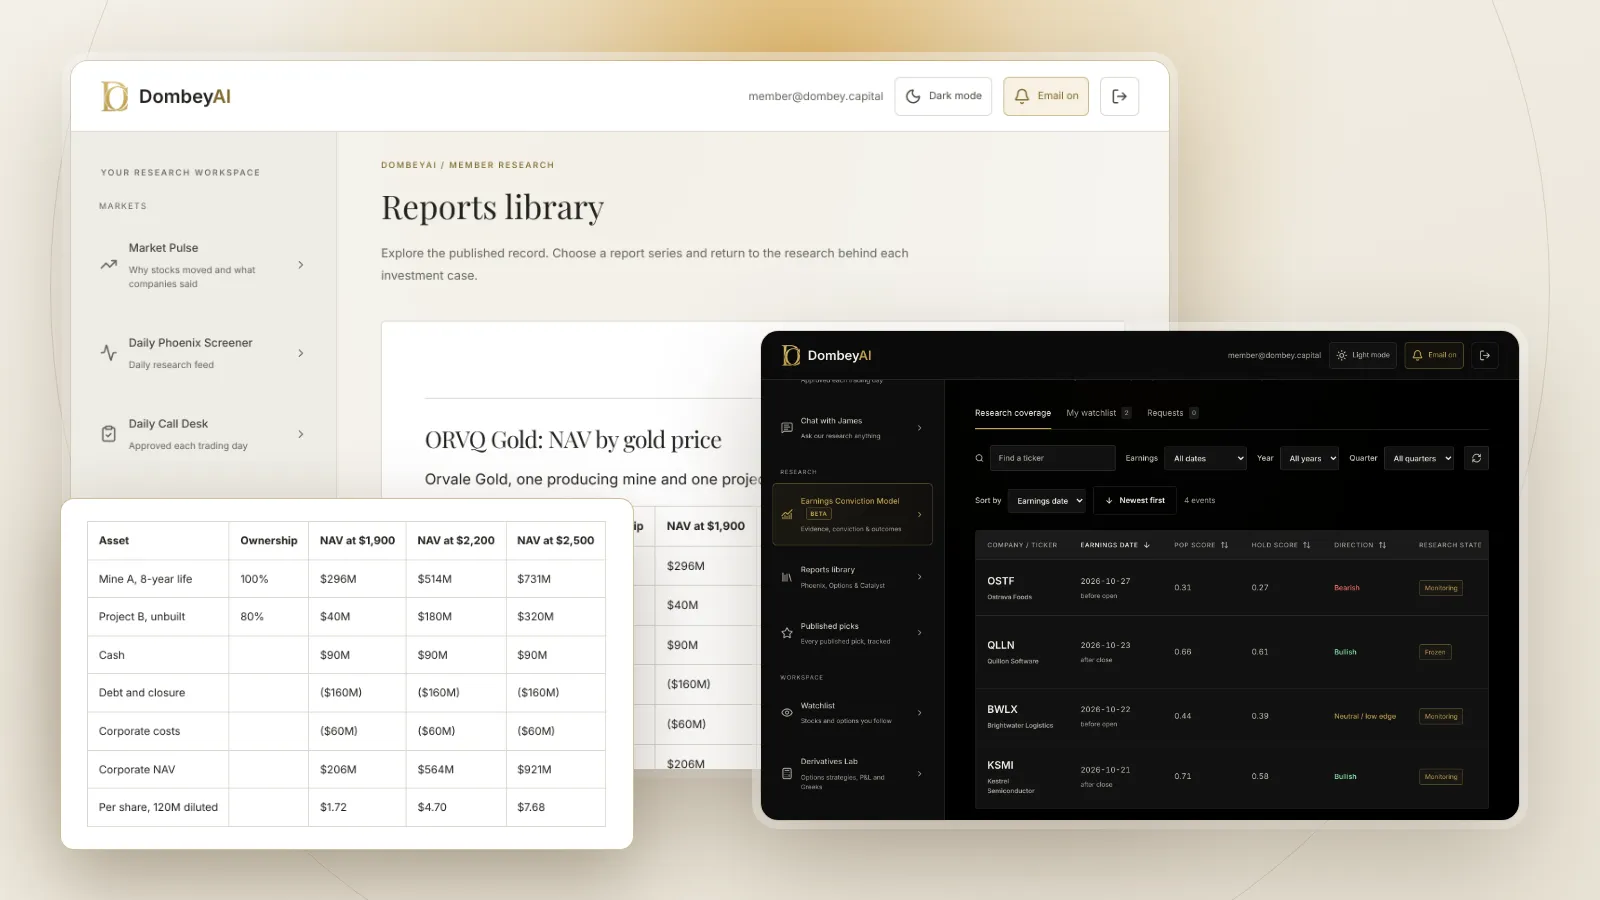
- A spreadsheet. A mining NAV is a discounted cash flow model built mine by mine.
Step 1: List the assets and pick the material ones
Start with the property disclosure in the annual report. List each mine and project, the company's ownership share, its stage (producing, in construction, development, exploration) and its location.
Most of the value usually sits in one to three assets. Model those in full and value the rest more simply, for example at a value per resource ounce or pound from comparable transactions. If the company owns royalties or streams, value them separately; a royalty is a different risk from an operating mine, as our explainer on royalty trusts shows.
Step 2: Read the reserves and resources
The technical report classifies the mineral inventory by confidence:
| Category | Confidence | How to use it in a NAV |
|---|---|---|
| Proven reserves | Highest; economically mineable, measured | Base of the mine plan |
| Probable reserves | Economically mineable, indicated | Base of the mine plan |
| Measured and indicated resources | Reasonable prospects, not yet shown economic | Possible life extension; value separately with a haircut |
| Inferred resources | Lowest confidence | Do not put in the base case; at most a small value per unit |
| Exploration targets | No resource yet | Option value only |
Note the tonnage, the grade (grams per tonne for gold, percent for copper) and the expected metallurgical recovery. Contained metal is tonnage times grade; recovered metal is contained metal times recovery. Recovered metal is what gets sold.
Step 3: Build the production schedule
The technical report usually includes a life-of-mine plan with tonnes mined, tonnes processed, grade and metal produced each year. Use it as the starting point, then check it against what the mine has actually delivered in recent quarters.
If a mine has consistently produced less than plan, cut the schedule. If grade is expected to fall later in the mine life, which is common once the best ore has been mined, make sure the plan shows it.
Step 4: Set the costs
Three cost groups matter:
- Operating costs: mining, processing, site general and administrative costs, per tonne or per unit of metal.
- Royalties and taxes: government and private royalties, mining taxes and income taxes. These vary widely by jurisdiction.
- Capital: initial capital for a project not yet built, and sustaining capital to keep a mine running.
For gold and silver producers, the World Gold Council's all-in sustaining cost (AISC) is the standard cost measure in reporting. It adds sustaining capital and corporate costs to cash costs. Compare reported AISC with the technical report's estimate, and use the higher of the two when the mine has a record of running over.
Step 5: Choose the metal price and discount rate
These two assumptions drive most of the value.
For the price, use a deck you can defend, such as a long-term price below the current spot price for a metal that has risen sharply, and run the model at several prices. For the discount rate, analysts commonly use lower rates for producing precious metals mines in stable jurisdictions and higher rates for base metals, development projects and riskier countries. Our explainer on WACC covers how a cost of capital is built, though mining analysts often apply a convention rate by asset type.
The example shows the leverage in a mine's value: a 14% lower gold price cut the NAV by more than 40%.
Step 6: Add the mines and adjust to equity
Add the NAV of each mine, at the company's ownership share. Then:
- Add cash and the value of investments, royalties and minor assets.
- Subtract debt, leases and other obligations, including any streaming or prepayment liabilities.
- Subtract the present value of corporate overhead not in the mine-level costs.
- Subtract closure and reclamation obligations not already in the mine models.
The result is the corporate NAV. If parts of the business differ in risk, treat it as a sum-of-the-parts valuation and apply a different rate or haircut to each.
Step 7: Account for funding and dilution
A developer that still has to build its mine needs money. Estimate the funding gap: initial capital plus working capital and a contingency, minus cash. Then decide how it is likely to be filled: debt, a stream, a royalty sale or new shares. Each has a cost. If equity is the likely source, add the new shares to the count at a price below today's, because miners often raise money at a discount. The dilution explainer covers how to do this.
Use the fully diluted share count, including options, warrants and convertible debt where they are in the money.
Step 8: Compare with the price and run scenarios
Divide the corporate NAV by diluted shares and compare with the share price. The ratio is price to NAV (P/NAV).
Then run at least three cases: a low price, your base price and a high price, with any operational risks you have flagged. Our guide on how to build a base and worst case shows how to lay them out. A mining stock that only works at today's spot price, or above, has little margin of safety.
Common mistakes
- Valuing resources as reserves. Inferred and much of measured and indicated material may never be mined at a profit.
- Trusting the study's capital estimate for a project not yet built. Construction costs often run over. Add a contingency beyond the study's own.
- Ignoring jurisdiction. Royalty increases, permits, export rules and changes to tax can move a NAV more than a change in grade.
- One price. A single-price NAV hides how sensitive the value is.
- Forgetting closure costs. Reclamation obligations are real cash costs at the end of the mine life, and they appear in the footnotes; see how to read the footnotes in a 10-K.
- Missing the funding gap. For developers, the shares to be issued can matter more than the project's NAV.
Data on reserves and costs is collected unevenly by commercial tools, which is why our list of the best stock research tools for individual investors treats filings as the primary source. The approach is close to valuing an oil and gas producer, where reserves, decline rates and prices play the same roles.
The bottom line
A mining stock is valued mine by mine: reserves, grade, recovery, costs and a metal price produce a cash flow that is discounted, added up and adjusted for debt, overhead, closure costs and dilution. The technical report is the source for most inputs, and recent operating results are the check on them. Because the metal price and discount rate drive the answer, a single NAV figure means little without the scenarios around it. Price to NAV then tells you how much of that value, at your assumptions, the market is paying for.