

How to calculate gross margin
The formula has two steps:
- Gross profit = revenue minus cost of goods sold (COGS)
- Gross margin = gross profit divided by revenue
Both inputs are on the income statement. Our guide on how to read an income statement shows where each line sits. Some companies report gross profit as its own line; others list cost of revenue and leave you to subtract.
What goes into COGS depends on the business. For a manufacturer it is materials, direct labor and factory overhead, including depreciation on production equipment. For a retailer it is the cost of merchandise and often freight and some occupancy costs. For a software company it is hosting, support and amortization of capitalized software. These differences are why comparisons across industries say little.
Typical gross margin ranges
| Business model | Typical gross margin range | What drives it |
|---|---|---|
| Software and subscription | High, often above 70% | Low cost to serve each added customer |
| Branded consumer products | Medium to high | Pricing power from brands |
| Industrial manufacturing | Medium | Materials, labor, utilization |
| Retail | Low to medium | Merchandise cost, markdowns, freight |
| Distribution and grocery | Low | Thin markups on high volume |
| Contract services | Varies widely | Labor cost and billing rates |
The ranges are broad and illustrative. A grocer with a 25% margin may be excellent and a software company with a 60% margin may be struggling. The level tells you the business model; the trend tells you how it is doing.
What drives a change in gross margin
When gross margin moves, there is almost always one of six causes behind it:
- Price. Raising prices faster than costs lifts margin; cutting prices to defend share lowers it.
- Mix. Selling more of a higher-margin product, or more in a higher-margin channel, raises the blended margin without any single product changing.
- Input costs. Raw materials, freight, energy and wages move costs. Contracts and hedges can delay the effect by several quarters.
- Utilization. Factories and networks have large fixed costs. Higher volume spreads them over more units. Our explainer on operating leverage covers why this effect can be large in both directions.
- Inventory accounting. Write-downs of obsolete stock, changes in cost methods, or the release of a reserve can move a quarter's margin sharply.
- Classification. Moving a cost between COGS and operating expenses changes gross margin without changing profit.
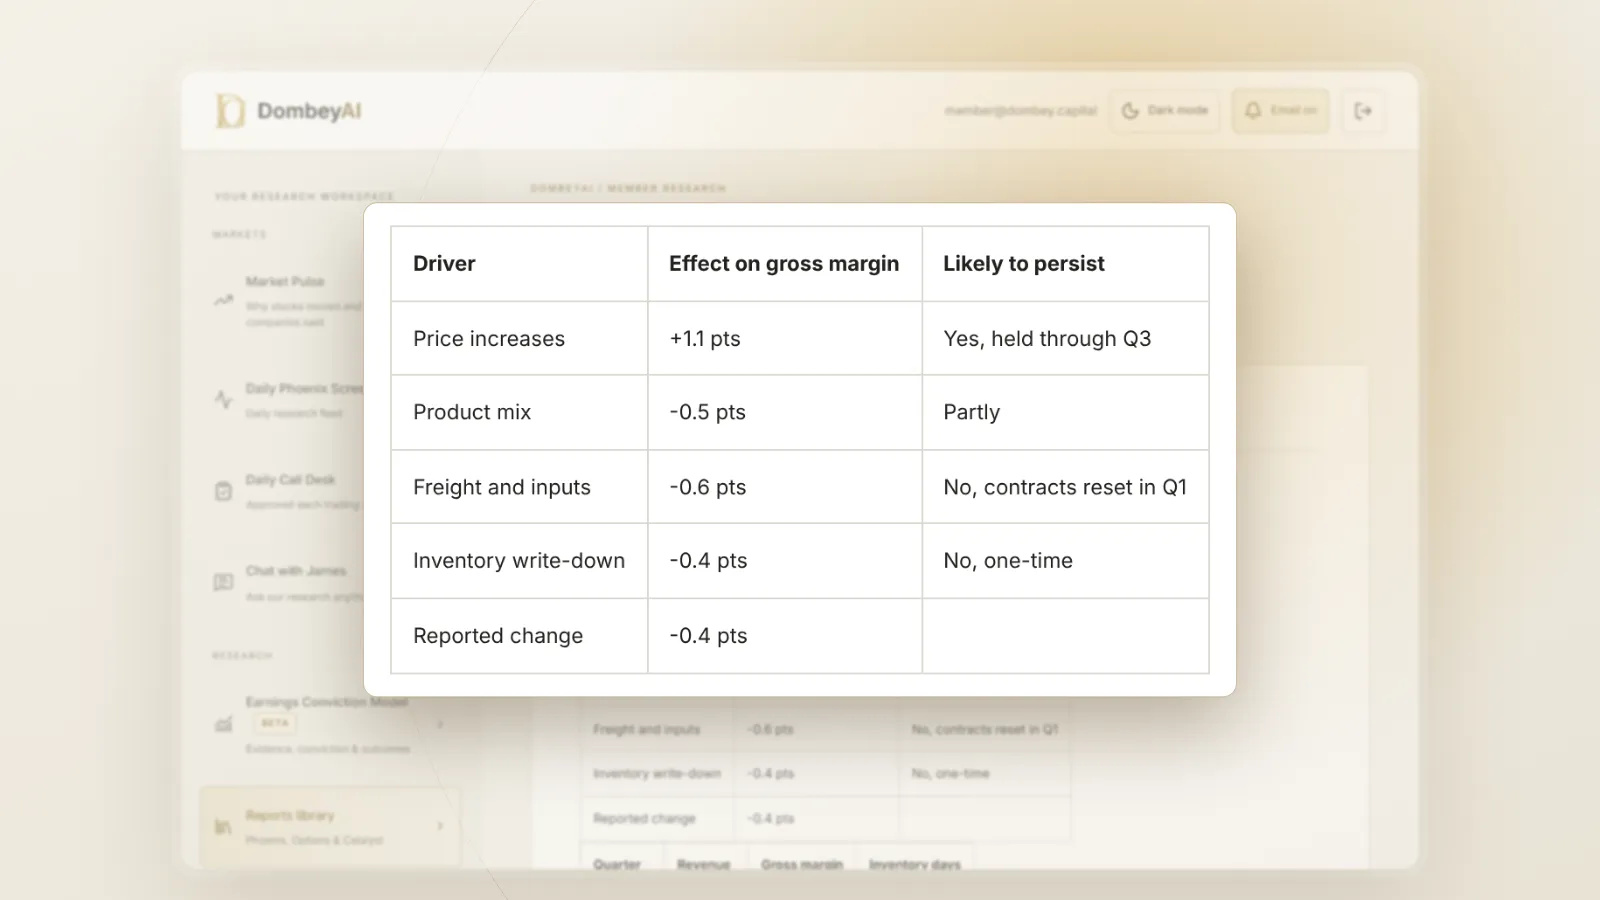
Several causes often act at once. A quarter can show a price increase lifting margin by a point while higher freight takes away half a point and a weaker mix takes away another half. The headline change is flat, but the price increase is the part most likely to persist, and the freight cost the part most likely to reverse. Breaking the change into its parts is the work that makes the number useful.
Management usually explains the change in the earnings release or on the call. Our guide on how to read an earnings release shows where the margin bridge is usually found, and the 10-Q's management discussion section often gives the drivers in more detail.
Lasting or temporary: how to tell
The most important question about a margin change is whether it will persist. A useful decision guide:
- If the improvement comes from price increases that held through a period of stable or falling costs, it is more likely to last.
- If it comes from a shift in mix toward a growing, higher-margin product, it is likely to last as long as that product keeps growing.
- If it comes from input costs falling, it can reverse when costs rise, unless the company keeps prices where they were.
- If it comes from higher utilization, it depends on volume holding up, and it can reverse quickly in a downturn.
- If it comes from an inventory reserve release or a one-time credit, treat it as non-recurring.
- If it comes from reclassifying costs, adjust prior periods to compare like with like.
Gross margin in valuation
Gross margin feeds valuation in several ways:
- Normalized earnings. When a company's margin is temporarily depressed or inflated, analysts estimate a mid-cycle margin to value it on normalized earnings.
- Price to sales. Two companies with the same sales and very different gross margins deserve different multiples. Our piece on the price-to-sales ratio explains why cheap sales only matter when they can turn into profit.
- Incremental margins. For a growing company, the margin on each added dollar of revenue matters more than the average.
- Catalysts. A credible path to higher margins, such as a price increase, a plant closure or a divestiture of a low-margin unit, can be a catalyst. Our piece on asset sales covers how selling a low-margin business can reset a company's reported margins.
Most stock research platforms chart gross margin history; our list of the best stock research tools for individual investors notes which show quarterly margins and segment detail.
Where this goes wrong
- Comparing across industries. A margin only means something against the company's own history and close peers.
- Different COGS definitions. Two retailers may treat occupancy or distribution costs differently. Check the accounting policy footnote; see how to read the footnotes in a 10-K.
- Ignoring segment mix. A consolidated margin can hide one segment improving and another declining.
- Missing one-time items. Restructuring charges, inventory write-downs and purchase accounting adjustments can sit in COGS for a quarter or two.
- Assuming gross margin is the whole story. A company can raise gross margin by cutting product quality or support, with the cost showing up later in lost revenue. And a rising gross margin can be offset by rising operating expenses.
- Overreading one quarter. Seasonal businesses have seasonal margins. Compare a quarter with the same quarter a year earlier.
Common mistakes
- Confusing margin and markup. A 40% margin is a 67% markup. Mixing them leads to wrong conclusions about pricing.
- Using adjusted gross margin without the reconciliation. Some companies exclude stock compensation or amortization from COGS in their adjusted figures. Reconcile to the reported number.
- Ignoring currency. Costs and revenue in different currencies can move margin without any change in operations.
- Projecting a peak margin forward. Margins at the top of a cycle often reflect conditions that do not last.
The bottom line
Gross margin is revenue minus cost of goods sold, divided by revenue, and it shows how much of each sales dollar is left for everything else. Its level mostly reflects the business model, so the signal lies in the change. Trace every move to price, mix, input costs, utilization, inventory accounting or classification, and judge whether that cause will persist. Compare with the company's own history and close peers, and read the footnotes before comparing across firms.