

What accruals are
Accrual accounting records revenue when it is earned and expenses when they are incurred, not when cash moves. That gives a truer picture of a period's activity, but it also opens a gap between profit and cash:
- A sale on credit raises revenue and receivables, with no cash yet.
- Inventory built for future sales absorbs cash without touching profit until it is sold.
- Costs capitalized as assets, such as software development, reduce cash now and reach the income statement later through amortization.
- Reserves and estimates, such as for bad debts or warranties, move profit without moving cash.
Accruals are the sum of these differences. Over a long period they reverse: receivables are collected or written off, inventory is sold or impaired. In any single year, a large build-up of accruals means part of the reported profit is still a promise.
The two formulas
Cash flow method:
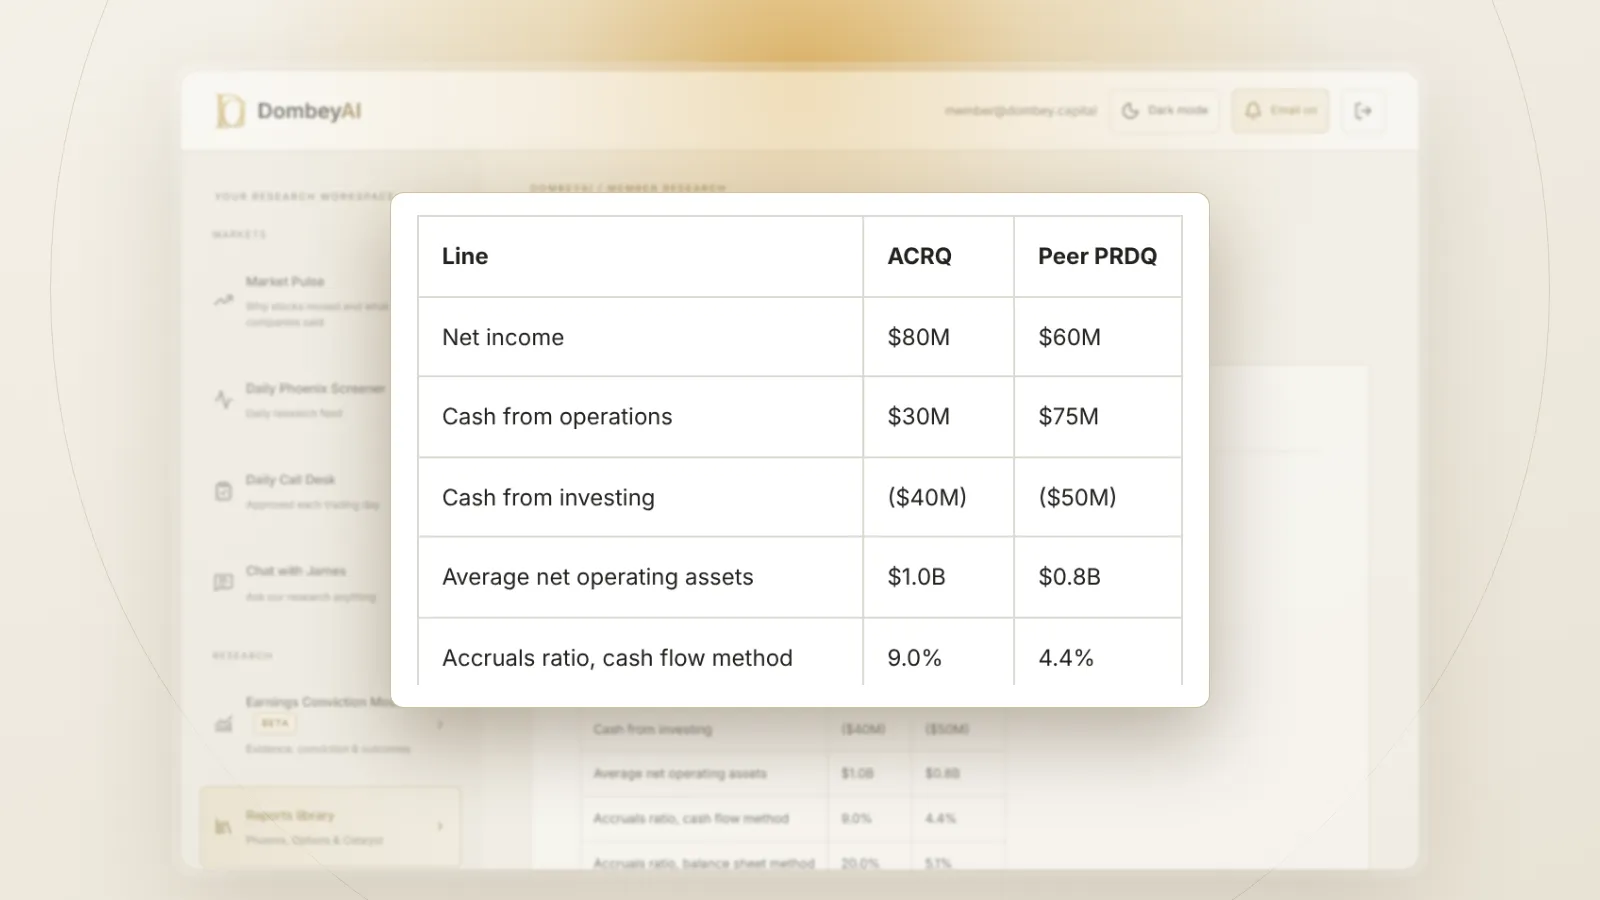
Accruals ratio = (Net income minus Cash flow from operations minus Cash flow from investing) / Average net operating assets
Including investing cash flow captures accruals in long-term assets, such as capitalized costs, that the operating cash flow line alone would miss. The data come straight from the cash flow statement.
Balance sheet method:
Accruals ratio = (Net operating assets at year end minus Net operating assets at the start) / Average net operating assets
Net operating assets are operating assets (total assets minus cash and investments) minus operating liabilities (total liabilities minus debt). The change in that figure is the year's accruals.
A simpler variant divides net income minus operating cash flow by average total assets. It is quick and common, but it misses long-term accruals.
The two main methods should give similar answers. Large differences often come from acquisitions and currency effects, which change the balance sheet without passing through the cash flow statement.
Quick reference: reading the ratio
| Ratio range | What it suggests | What to check |
|---|---|---|
| Negative | Cash ahead of profit | Collections of old receivables, heavy depreciation |
| Near zero | Profit and cash in step | Little to check on this measure |
| Moderately positive | Some profit not yet in cash | Normal for growing companies; check trend |
| High, or up sharply | Profit well ahead of cash | Receivables, inventory, capitalized costs, estimates |
| High for several years | Persistent gap | Revenue recognition, reserves, possible restatement risk |
The bands are guides, not cut-offs. Industries differ, and growth raises accruals naturally.
A worked example
In Company A's case the footnotes might show receivables up 35% on revenue up 12%. That is the line to investigate: longer payment terms, a large customer paying late or revenue booked ahead of delivery.
How to calculate it from a 10-K
You need two years of balance sheets and one year's cash flow statement, all in the 10-K:
- Take net income from the income statement, before any amount attributable to noncontrolling interests if the cash flow statement starts from that figure.
- Take cash flow from operations and cash flow from investing from the cash flow statement.
- Compute net operating assets for both year ends: total assets minus cash and short-term investments, minus total liabilities excluding debt and lease liabilities treated as debt.
- Average the two net operating asset figures.
- Apply the formula and record the result next to prior years.
- Reconcile the two methods if they differ, starting with acquisitions, disposals and currency effects in the footnotes.
Do it for at least three to five years. The trend matters more than any single year, and a sudden jump in one year points to the line items to read first. Our guide on how to read the footnotes in a 10-K shows where receivables, inventory and capitalized costs are broken out.
What drives high accruals
When the ratio is high, find the line that caused it:
- Receivables growing faster than sales. Days sales outstanding rising. Possible looser credit terms or aggressive recognition.
- Inventory growing faster than cost of sales. Possible weak demand or obsolete stock.
- Capitalized costs. Software, customer acquisition costs or interest capitalized into assets.
- Lower reserves. Smaller allowances for bad debts or warranties boost profit without cash.
- Prepaid and other assets. Small lines that sometimes grow quickly.
Working capital analysis covers most of these. On the other side, deferred revenue is a liability that lowers accruals: cash arrives before profit is booked.
How investors use it
- Earnings quality check. Before trusting a valuation on reported earnings, see whether cash backs them. Our explainer on normalized earnings covers adjusting the base.
- Combined screens. The Piotroski F-Score includes a test of whether operating cash flow exceeds net income, and the Beneish M-Score includes an accruals measure among its eight variables.
- Valuation cross-check. A stock that looks cheap on earnings but not on free cash flow yield often has high accruals.
- Short research. Persistent high accruals, with rising receivables and changing estimates, are a common thread in cases that end in a financial restatement.
Many data platforms in our list of the best stock research tools for individual investors show cash flow and balance sheet history, enough to compute the ratio yourself.
Where this goes wrong
- Growth looks like poor quality. A fast-growing company builds receivables and inventory naturally. Compare accruals with the growth rate.
- Acquisitions distort the balance sheet method. Purchased assets raise net operating assets without operating accruals.
- Seasonality. Year ends in the middle of a selling season inflate working capital.
- Industry differences. Contractors, distributors and software companies have very different normal accrual levels. Compare with peers.
- Low accruals are not proof of quality. A company can manage cash flow too, for example by delaying payments to suppliers or selling receivables.
- Definitions vary. Different sources use different formulas. Know which one you are looking at.
The bottom line
The accruals ratio measures how much of a company's profit is not yet backed by cash, scaled by its operating assets. A high or rising figure says to look harder at receivables, inventory, capitalized costs and estimates, because accrual-based earnings tend to persist less than cash earnings. It does not prove manipulation, and growth, acquisitions and industry norms all move it. Use it as a prompt to read the footnotes, compared with the company's own history and its peers.