

What you need
- The latest 10-K and recent 10-Qs for the company, from EDGAR. Our guide on how to search SEC EDGAR filings shows how to find them.
- A spreadsheet: Excel or Google Sheets.
- The latest diluted share count, from the cover of the most recent 10-Q or 10-K and the earnings per share note.
- Debt, cash and lease figures from the balance sheet and debt footnote.
- Optional: a data platform export to save typing, checked against the filings. Our list of the best stock research tools for individual investors notes which export financials cleanly.
- An hour or two for a first version.
Step 1: Lay out the sheet
Split the spreadsheet into three clear areas:
- Inputs. Every assumption, in one place, in a distinct color (many modelers use blue text for inputs).
- Calculations. Historical figures and forecasts, with years across the columns and line items down the rows.
- Outputs. Free cash flow, valuation and value per share.
Put historical years on the left and forecast years on the right, with a visible break between them. Label units on every row: millions of dollars, percent, shares in millions. A model whose units are unclear will eventually mix them.
Step 2: Enter the historical figures
Enter three to five years of:
- Revenue, cost of goods sold and gross profit
- Operating expenses (selling, general and administrative, and research and development)
- Operating income, interest, taxes and net income
- Depreciation and amortization
- Capital expenditures and changes in working capital
- Cash, debt, leases and diluted shares at each year end
Use the reported figures, then note one-time items separately so you can see underlying trends. Our guide on how to read a 10-Q for special situations covers where unusual items hide. Check that your gross profit and operating income match the filing exactly before going on.
Step 3: Calculate the historical drivers
Turn the history into ratios that will drive the forecast:
| Driver | Formula | Why it matters |
|---|---|---|
| Revenue growth | This year's revenue / last year's revenue minus 1 | Sets the top line |
| Gross margin | Gross profit / revenue | Product economics and pricing power |
| Operating expense ratio | Operating expenses / revenue | Cost discipline and operating leverage |
| Tax rate | Taxes / pre-tax income | Converts operating profit to after-tax profit |
| D&A to revenue | Depreciation and amortization / revenue | Non-cash charge, added back for cash flow |
| Capex to revenue | Capital expenditures / revenue | Reinvestment needed |
| Working capital to revenue | Net working capital / revenue | Cash tied up as the business grows; see working capital explained |
Seeing several years of each ratio side by side is often the most useful output of the whole exercise. It shows what the company has actually been able to do.
Step 4: Set the forecast assumptions
Choose a value for each driver in each forecast year, in the inputs area. Anchor each one to history:
- If revenue grew 4% to 7% for five years, a forecast of 15% needs a stated reason, such as a new contract or acquisition.
- If gross margin ranged from 38% to 41%, start inside that range unless something specific is changing.
- If capital spending ran at 5% of revenue, keep it there unless a plant is being built or closed.
Write a one-line note beside each assumption explaining it. That note is what you will check when the next quarter is reported.
Step 5: Build the forecast
Link every forecast cell to an input and the prior year. Revenue equals last year's revenue times one plus growth. Gross profit equals revenue times gross margin. Operating expenses equal revenue times the expense ratio. Operating income, taxes and net operating profit follow.
No typed numbers belong in forecast cells. If you need to override a figure, put the override in the inputs area so it is visible.
Step 6: Calculate free cash flow
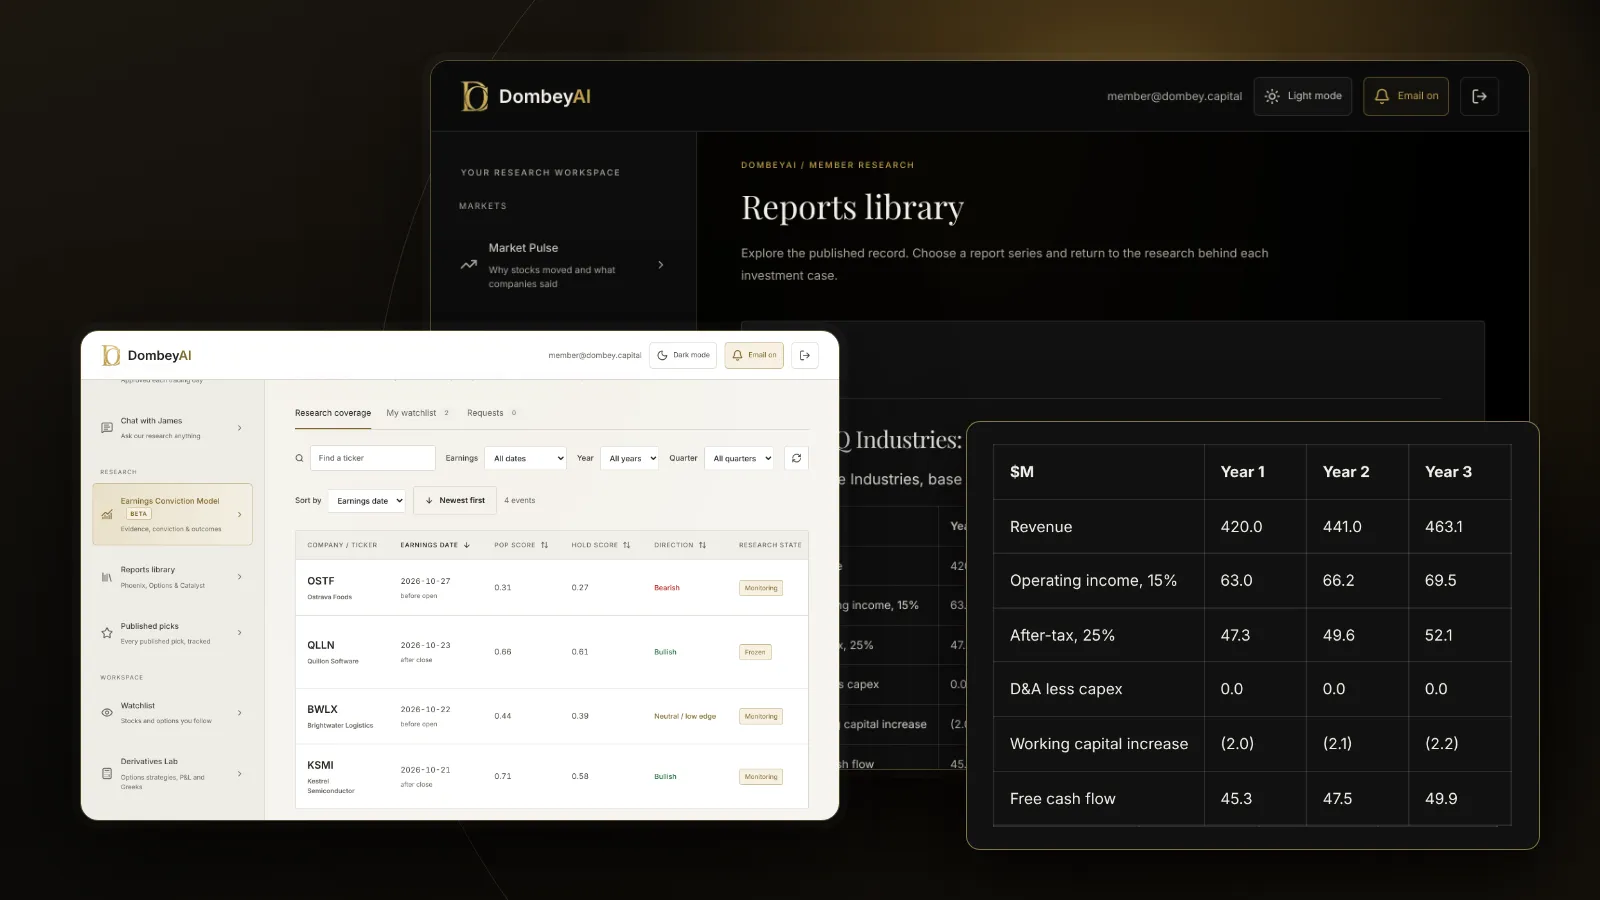
For a simple model, unlevered free cash flow is:
- Operating income times (1 minus the tax rate)
- Plus depreciation and amortization
- Minus capital expenditures
- Minus the increase in working capital
This is free cash flow to the firm, before interest. Our explainer on FCFF and FCFE explains when to use the levered version instead.
Step 7: Value the business and get to value per share
Two simple ways to value the forecast:
- Discounted cash flow. Discount each year's free cash flow and a terminal value at a chosen rate. See what a DCF is and terminal value.
- Exit multiple. Apply a multiple, such as EV/EBITDA, to a forecast year's figure.
Either gives enterprise value. Subtract debt and leases, add cash, and adjust for anything else that sits between enterprise and equity value, such as preferred stock or minority interests. Divide by the diluted share count. Our guide on how to map a capital structure covers what to include.
Step 8: Add a downside case and a sensitivity table
Copy the inputs into a second column for a downside case: slower growth, lower margins, higher capex. Our guide on how to build a base and worst case covers how to choose the downside drivers.
Then build a small table showing value per share across two inputs, such as the exit multiple and the operating margin. The table shows which assumption the answer depends on most.
Step 9: Check the model
| Check | What to look for | Where to confirm |
|---|---|---|
| History matches filings | Revenue, operating income, net income | 10-K and 10-Q |
| Totals add up | Gross profit, operating income, free cash flow | Recalculate by hand once |
| No hard-coded forecasts | Every forecast cell is a formula | Click through each row |
| Inputs move outputs | Change growth by 1 point and check the direction | Sensitivity table |
| Share count is diluted | Includes options, RSUs and convertibles where relevant | EPS footnote |
| Net debt is complete | Debt, leases, cash, preferred, minorities | Balance sheet and footnotes |
Where this goes wrong
- False precision. A model with values to the cent implies a certainty the inputs do not support. Round outputs and read them as ranges.
- Forecasts that drift from history. Small optimistic changes in several drivers compound into a large overstatement.
- Ignoring the event. For special situations, the value often depends on a catalyst, such as a sale or a spin-off, that a steady forecast does not capture.
- Missing claims on equity value. Leases, pensions, earn-outs and dilution can sit outside the obvious debt line.
- Treating the output as the answer. The model tests assumptions; it does not produce them.
Common mistakes
- Typing numbers into forecast cells. It breaks the link between assumptions and results.
- Using basic instead of diluted shares. It overstates value per share.
- Mixing fiscal and calendar years. Align periods before comparing with peers.
- Double-counting cash. Cash added to enterprise value should not also be in working capital.
- Never updating. A model built once and never revisited goes stale with the first quarterly report.
The bottom line
A simple financial model links a few drivers to forecast earnings, free cash flow and value per share. Build it from reported history, keep inputs separate from calculations, and make every forecast cell a formula. Be careful with the share count and net debt, and add a downside case and a sensitivity table to see what the answer depends on. Treat the model as a way to test your assumptions against what the company has done, and update it each quarter.