

What you need
- The latest 10-K and 10-Q from SEC EDGAR. Item 1 of the 10-K describes each program, its stage, its partners and its patents. The EDGAR search guide shows how to pull them quickly.
- The trial records on ClinicalTrials.gov for each program: design, endpoints, enrollment and expected completion dates.
- The company's latest investor presentation, read with skepticism, for timelines and market size claims.
- Any license or collaboration agreement filed as an exhibit, for milestones and royalty rates.
- A spreadsheet with one block per program.
Step 1: List the programs and what the company owns of each
Make one row per program and indication. Record the stage (preclinical, Phase 1, Phase 2, Phase 3, filed), the disease, the next data readout and the company's economic share.
The share matters as much as the drug. A wholly owned program earns the full margin. A partnered program may earn only milestones and a royalty, while the partner pays the trial costs. A program licensed in from a university may owe a royalty out. Read the agreement exhibits, not the press release, because the release rarely states the royalty tiers.
Drop programs you cannot describe in one line. Preclinical assets and "platform" claims rarely change the answer, and including them invites optimism.
Step 2: Size each drug if it is approved
For each program, build a simple revenue line assuming approval: the number of patients treated, the net price per patient per year, and a ramp from launch to peak sales over several years. Then apply a margin to get cash flow. For a wholly owned drug, include cost of goods, launch and sales spending, and tax. For a partnered drug, use the royalty rate on the partner's sales and any sales milestones.
Set the end of the cash flows at loss of exclusivity. Patents run 20 years from filing, with a possible extension for time lost in FDA review. Regulatory exclusivity runs alongside: 5 years for a new chemical entity, 7 years for an orphan indication and 12 years for a new biologic before a biosimilar can be approved. Revenue usually falls sharply once generics or biosimilars arrive, so do not let a terminal value carry the drug forever. The explainer on terminal value covers why that assumption is so powerful.
Discount the cash flows to the launch date. That gives a value if approved, measured at launch.
Step 3: Assign a probability of success to each stage
The probability is the most important input. Start from published industry rates by phase and disease area. The BIO, Informa and QLS report on clinical development success rates from 2011 to 2020 put the overall chance of approval from Phase 1 at 7.9 percent, and found Phase 2 to be the hardest step. Rates differ widely by disease area and drug type, so use the breakdown that matches the program.
Then adjust for what the program has already shown. A Phase 3 trial that repeats a Phase 2 result on the same endpoint deserves more credit than one that changed the endpoint or the patient population. An approved drug from the same class or a validated target supports a higher rate. Small, open-label or single-arm data supports a lower one. The explainer on how Phase 3 readouts move stocks covers what to look for in the design.
Multiply the stage probabilities to get the cumulative chance of reaching the market. A Phase 2 program has to pass Phase 2, Phase 3 and FDA review.
Step 4: Subtract the risk-weighted cost of development
Each remaining stage costs money, and the company only spends it if the earlier stage succeeds. Weight each stage's cost by the probability of reaching that stage. Phase 3 spending on a program now in Phase 1 is weighted by the chance of passing Phases 1 and 2, which is low.
Discount the weighted costs to today. Subtract them from the risk-adjusted value of the program. The result is the program's rNPV.
Do not be surprised if an early program comes out negative. A Phase 1 asset that will need an expensive Phase 3 and has a modest market can be worth less than the cost of developing it. That is useful information about whether management's spending creates value.
Step 5: Discount to today and apply the probability
Take the value if approved at launch, discount it from the launch date to today, and multiply by the cumulative probability. Use a discount rate that reflects the cost of capital for the business if the drug works. The probabilities already carry the trial risk. Using a very high rate on top of low probabilities counts the same risk twice. The explainer on WACC covers how a cost of capital is built.
Get the timing right. The FDA's goal for a standard review of a new molecular entity is 10 months from the 60-day filing date, and 6 months for a priority review. Add the time still needed to finish the trial, analyze it and file. A delay of a year costs a full year of discounting. How PDUFA dates work explains the review calendar.
Worked example
| Program | Stage | Value if approved, today ($M) | Probability | Risk-adjusted ($M) | Costs ($M) | rNPV ($M) |
|---|---|---|---|---|---|---|
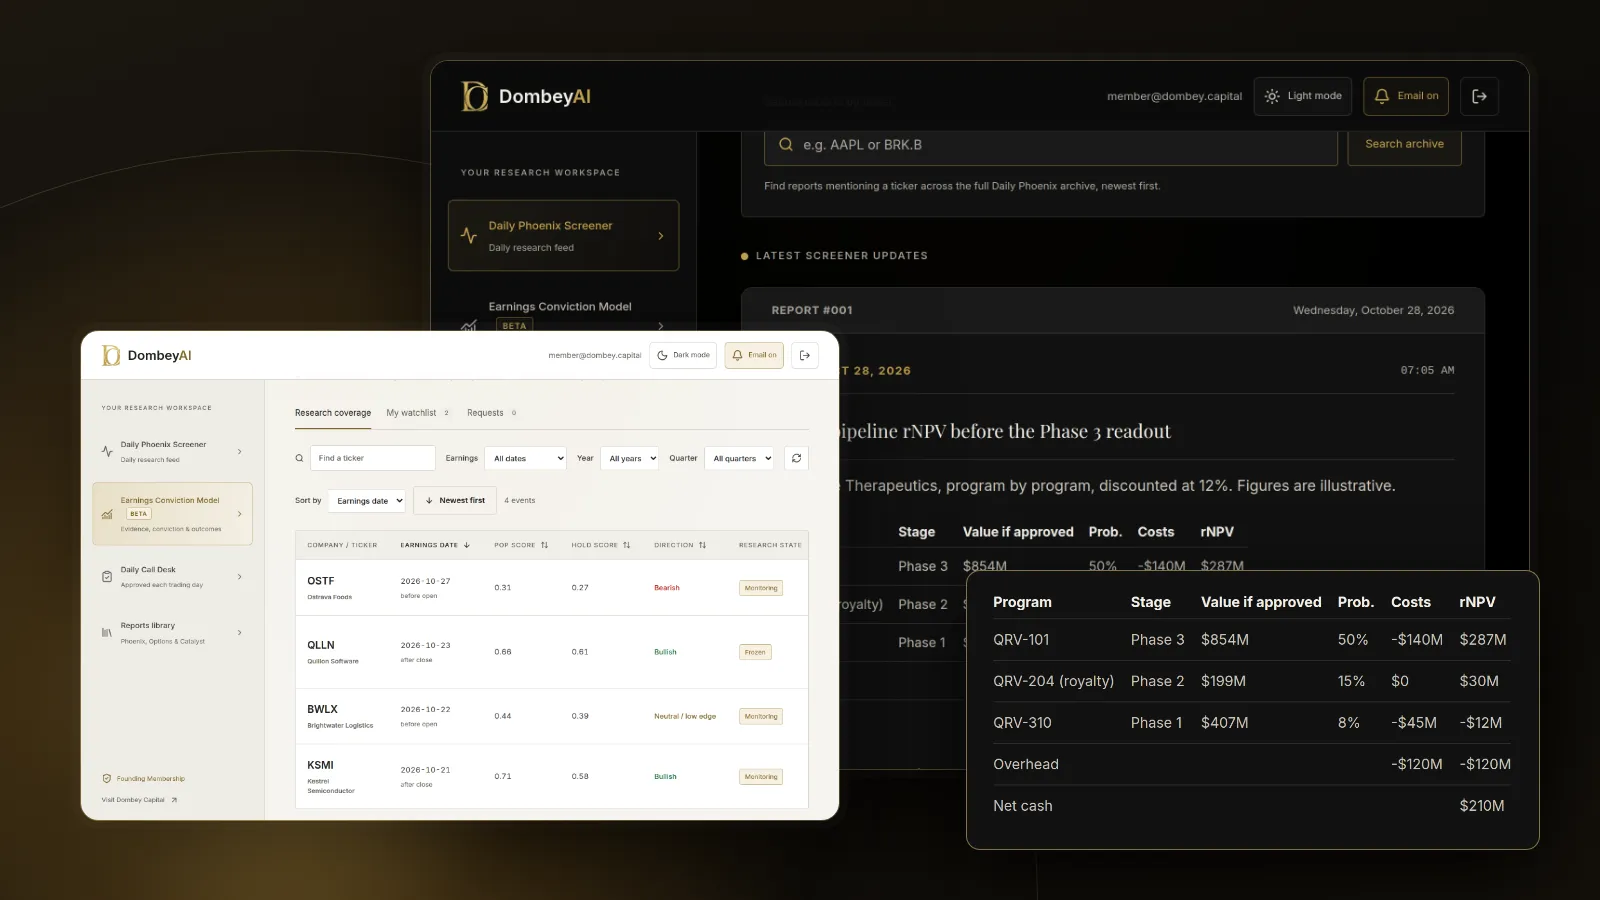
| A1, wholly owned | Phase 3 | 854.1 | 50% | 427.1 | -140.0 | 287.1 |
| A2, royalty | Phase 2 | 198.6 | 15% | 29.8 | 0.0 | 29.8 |
| A3, wholly owned | Phase 1 | 407.1 | 8% | 32.6 | -45.0 | -12.4 |
| Corporate overhead | -120.0 | -120.0 | ||||
| Net cash | 210.0 | |||||
| Total | 394.4 |
That is about $7.30 a share. The lead program accounts for nearly all of the pipeline value, and the Phase 1 program subtracts value at these assumptions.
Step 6: Add overhead, cash and the dilution still to come
Pipeline values are not the company's value. Subtract the present value of general and administrative costs that the programs do not carry, for as long as the company will exist in its current form. Add cash and investments, less debt. The explainer on net cash per share covers what to count.
Then check the cash runway against the timeline. If Company A needs to fund Program A1 to launch and its cash runs out a year before, it will raise equity, and the new shares will claim part of the value. Estimate the raise and the likely price, and add the new shares to the denominator. The guide on how to estimate cash runway shows how to date the next financing, and the explainer on dilution covers warrants, options and convertible notes.
Step 7: Compare with the price and back-solve the lead program
The total is a single number built on several uncertain inputs. The more useful test is to ask what the share price implies.
At a share price of $6.00, Company A's equity is worth $324 million. Holding the other lines fixed at $107.4 million, the market is paying $216.6 million for Program A1. That implies a chance of approval of about 42 percent against the 50 percent in the model. The research question is now narrow: is there a reason in the data or the trial design to expect less than a coin flip, or is the market discounting something else, such as dilution or overhead?
- If the implied probability is well below yours, look for the trial design flaw, safety signal or financing risk the market may be pricing before you trust your number.
- If the implied probability is well above yours, check whether the market is giving credit to an earlier program or a likely partnership you have left out.
- If one readout moves the value by more than half, the stock is a position on that readout, and its date matters most.
Dombey's published research works through this kind of implied-probability test before each catalyst; see the research archive. For a comparison of data and screening tools that help with the inputs, see the best stock research tools for individual investors.
Where this goes wrong
The model is very sensitive to the probability on the lead program. In the example, cutting Program A1's chance from 50 to 35 percent lowers the total from $394 million to about $266 million, or from $7.30 to $4.93 a share. Run a range of probabilities and see whether the conclusion survives.
Peak sales estimates are often too high. Company presentations size markets by the total number of patients, not those who would be diagnosed, eligible, reimbursed and treated. Launch curves are usually slower than the model assumes.
Binary outcomes do not average out in a single stock. The expected value of a program with a 50 percent chance is not a price the stock will ever trade at. After the readout it trades near the success value or the failure value. Position sizing has to reflect the failure branch, which the guide on sizing a position before a binary event covers.
Finally, management can destroy value by spending cash on weak programs. A company with a negative-rNPV program and a long runway may spend shareholders' cash on it anyway.
Common mistakes
- Using the company's market size as peak sales. Build patient numbers from the trial criteria and realistic uptake.
- Double counting risk. Use trial probabilities or a high discount rate, not both at full strength.
- Ignoring the partner's share. A royalty of 10 percent on $1 billion of sales is $100 million, not $1 billion.
- Valuing past loss of exclusivity. Revenue falls when generics or biosimilars arrive.
- Leaving out overhead. G&A runs every year whether trials succeed or fail.
- Dividing by today's share count. A company with two years of cash and four years to launch will issue more shares.
The bottom line
A biotech pipeline is worth the sum of its programs' risk-adjusted values, less overhead, plus net cash, divided by the share count after the next raise. Build each program from its value if approved, its timing, its stage probabilities and its remaining costs, and keep the discount rate separate from trial risk. Then back-solve the probability the price implies for the lead program, because that comparison is where the research question sits. Update the model at each readout, filing and FDA decision.