

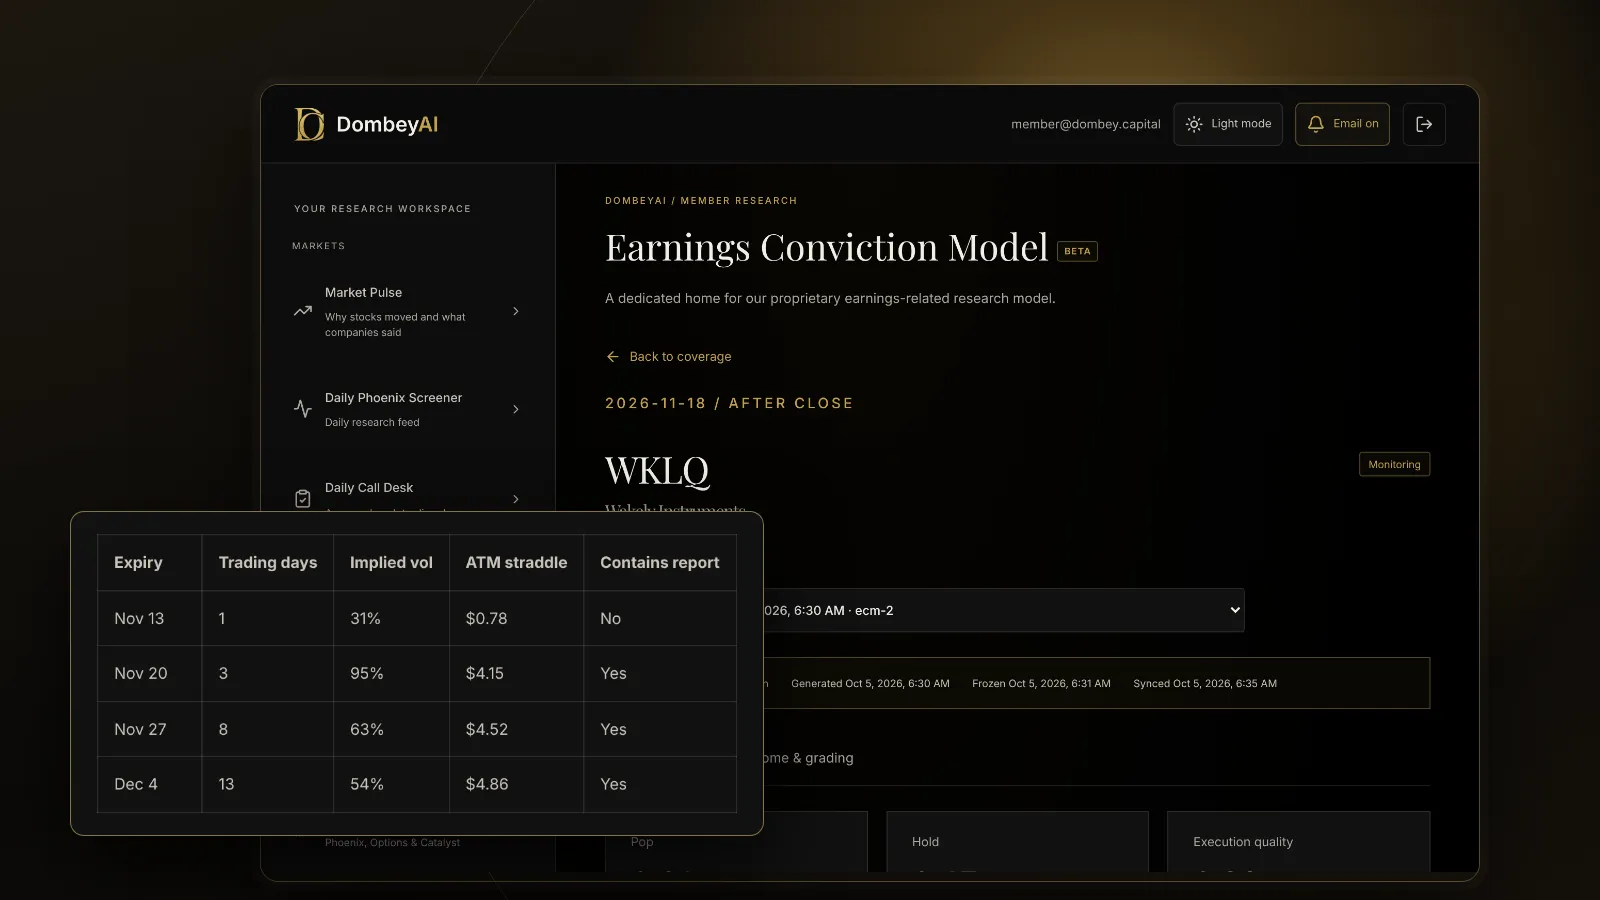
What weekly options are
Weekly options are standardized exchange-listed contracts with the same terms as the familiar monthly options: the same underlying, the same contract size and the same exercise and settlement rules. The difference is the calendar. Monthly options traditionally expire on the third Friday of the month. Weeklies are listed with a short life and expire on the other Fridays, so a stock with weeklies can have an expiration every week for the next several weeks.
Some index and ETF products go further and have expirations on other weekdays. For single stocks, the common pattern is a Friday expiry each week, with the monthly expiry still on the third Friday.
Not every stock has them. Exchanges choose which products get weekly series, and they tend to be larger, actively traded names. A small company with one dated catalyst may only have monthly expiries, which changes how you read its event pricing, as later sections show.
If you are new to the vocabulary, the option Greeks and how to read an option chain cover the basics this article builds on.
Why short expiries isolate event risk
An option's price reflects how much the stock is expected to move before expiration. Two kinds of movement go into that:
- Ordinary daily movement. The background noise of news, flows and sector moves that happens every trading day.
- The event. A single day, such as the morning after an earnings report, on which a much larger move is likely.
In a monthly option with 30 days left, the event is one day among roughly 20 trading days. Its effect is diluted by all the ordinary days around it. In a weekly that expires two days after the report, the event is one of two or three trading days. Most of the option's value comes from the event itself.
That is why weekly implied volatility before an event looks extreme. Implied volatility is quoted as an annual figure. If one day is expected to carry a 6% move, spreading that across a two-day option and then annualizing it produces a very high number. The figure is not a sign of panic; it is the arithmetic of putting a large one-day move into a short window.
How to read the implied event move
The quickest estimate is the at-the-money straddle: one call and one put at the strike nearest the stock price, in the first expiry after the event. The straddle price divided by the stock price approximates the move the market expects by expiration, in either direction. Our explainer on how a straddle prices an event covers the mechanics, and the step-by-step guide to estimating an earnings move from options walks through the full calculation.
A cleaner estimate separates the event from the ordinary days. Use two expiries:
- Take the implied volatility of a weekly that expires before the event, or the stock's usual level in weeks with no news. This approximates ordinary daily volatility.
- Take the implied volatility of the first weekly after the event.
- Convert both into total variance over their lives (volatility squared, times time in years).
- The extra variance in the event expiry, beyond what ordinary days would explain, is the variance attributed to the event day. Its square root is the implied event move.
The two methods rarely match exactly. The straddle includes some ordinary movement and is affected by the bid-ask spread; the variance method depends on which expiry you treat as the baseline.
Quick reference: weekly versus monthly options around an event
| Feature | Weekly covering the event | Monthly covering the event |
|---|---|---|
| Share of value from the event | Most of it | Smaller, diluted by ordinary days |
| Implied volatility before the event | Very high | Elevated, less so |
| Drop in implied volatility after | Large | Moderate |
| Time decay per day | Fast | Slower |
| Gamma near expiration | High | Lower |
| Liquidity | Often thinner, varies by name | Usually the deepest series |
| Best use | Reading the implied event move | Holding a view with time to be right |
What the shape across weeklies tells you
Lining up the weeklies in order gives a short volatility term structure. Before an event, the curve usually has a kink: implied volatility is low in the expiries before the event, jumps in the first expiry after it, then declines as later expiries dilute the event across more days.
- A sharp kink at the event expiry means the market is pricing a distinct, large one-day move.
- A flat curve across the event can mean the market sees little news value in the date, or that options are thin and quotes are stale.
- An elevated curve everywhere means risk is not confined to the event. A pending deal, a lawsuit or general market stress lifts every expiry.
- A kink in an unexpected week can point to a date the market expects that you have not marked, such as a conference presentation or a regulatory decision.
Weeklies also help when the event date is uncertain. If a company has not confirmed its report date, the volatility pattern across the next few weeklies often shows which week the market is betting on.
Weeklies beyond earnings
Earnings are the most common use, but the same reasoning applies to any dated catalyst with a known window:
- Court rulings and verdicts with a scheduled hearing or deadline.
- Regulatory decisions, such as an FDA action date, where the date is fixed in advance. Our explainer on how PDUFA catalysts work covers that calendar.
- Shareholder votes on mergers and proxy contests.
- Index additions and deletions with a known effective date.
For a catalyst with an uncertain date, such as a deal closing "in the fourth quarter", weeklies are less useful. The event may fall after the expiry, and you pay fast decay while you wait.
Where this goes wrong
Weekly options give a clear read, but several things distort it:
- Wide bid-ask spreads. In thin weeklies the midpoint can be far from where you could trade. A $0.40 spread on a $3.00 straddle changes the implied move by more than a percentage point. Our piece on how wide spreads distort options signals explains how to check.
- The wrong baseline. If the expiry you use as ordinary volatility also contains news, the event estimate shrinks.
- Early exercise and dividends. American-style stock options and an ex-dividend date inside the expiry change put and call prices in ways the simple straddle ignores.
- Pin risk and gamma. Near expiration, small moves around a strike change positions quickly. Pin risk is most acute in weeklies.
- Crush after the event. Even when the stock moves, the option can lose value if the move is smaller than the one priced in. Our explainer on IV crush after earnings shows the mechanics.
- Direction. A straddle prices the size of the move. It says nothing about whether the stock goes up or down.
Pros
- The cleanest market read of a single event's expected size.
- Lets you compare the priced move with your own estimate before a catalyst.
- Shows which week the market expects a news date to fall in.
Cons
- Fast decay and high gamma make positions fragile.
- Thin series can produce misleading midpoints.
- Not available on many smaller stocks.
How to use weeklies in a research process
A practical routine before a dated catalyst:
- If the stock has weeklies, read the implied event move from the first expiry after the date and compare it with the stock's history of moves on similar events.
- If the priced move looks small against history, the market may be underpricing the event; if it looks large, the market may already reflect the risk you are worried about.
- If the stock only has monthlies, use the variance method with the monthly before and after the event, and expect a noisier estimate.
- If spreads are wide, record the implied move from the bid and the ask as a range rather than a single number.
Dombey's options research reads these event prices before each catalyst it covers; recent examples are on the market page.
The bottom line
Weekly options isolate event risk because so little ordinary time sits inside them. The first weekly after a catalyst gives the cleanest read of the move the market expects, and the volatility of the weeklies around it separates the event from normal daily noise. That read is only as good as the quotes behind it, and it prices the size of a move, never its direction. Use weeklies to measure what is priced in, then judge whether your own evidence says the market has it right.