

What a two-peaked outcome looks like
Most days, a stock's possible prices next month form one hump: small moves are common and large moves are rare. A binary event changes that. Consider a biotech awaiting a PDUFA decision. If the drug is approved the stock may trade near one level; if it is rejected, near a much lower one. The current price is a blend of the two, and is itself an unlikely place to end.
The same shape appears before:
- Phase 3 trial readouts and FDA advisory votes.
- Court rulings in large patent or antitrust cases.
- Merger votes and regulatory decisions on a pending deal, where the stock trades toward either the deal price or the undisturbed price. See deal breaks.
- Contract awards for companies that depend on one large customer.
Why standard models struggle
The Black-Scholes model assumes continuous trading, constant volatility and lognormal prices. Each assumption fails before a binary event:
| Model assumption | Before a binary event | Effect on pricing |
|---|---|---|
| One peak near today's price | Two peaks, low chance of ending near today | One implied volatility cannot fit all strikes |
| Continuous price path | A gap on the event date | Hedging with delta fails across the gap |
| Constant volatility | Volatility very high into the event, then collapses | Vega and term structure distort |
| Moves scale smoothly with time | Most of the move happens on one day | Time decay concentrates around the event |
The market still quotes these options in implied volatility, because that is the standard unit. But the number is now a fitting parameter, not a description of how the stock moves.
What the volatility smile shows
Normally, equity implied volatility is higher for low strikes than for high strikes, a pattern covered in options skew. Before a binary event, the shape around the money often changes. At-the-money options can carry higher implied volatility than strikes a little above and below, giving a frown rather than a smile.
The reason is mechanical. If the stock will almost surely move far, an option struck at today's price is very likely to end either well in the money or worthless, and its price reflects the full size of the jump. Strikes in the gap between the two peaks behave in a similar way, and the model can only reconcile all of them with a bent curve.
The volatility term structure shows the event too. The expiry that covers the event date carries much higher implied volatility than the expiry before it.
Reading the market's own distribution
Option prices contain a full implied distribution, not just one volatility number. A butterfly spread, long one call at each of two outer strikes and short two at the middle strike, pays only if the stock ends near the middle strike. Its price is roughly proportional to the market's probability for that zone. Our explainer on the butterfly spread covers the structure.
Pricing butterflies across all strikes before a binary event often shows two humps. Our page on implied probabilities from option prices walks through the method. Wide bid-ask spreads make the picture noisy in small names, so read it as a sketch.
A worked example
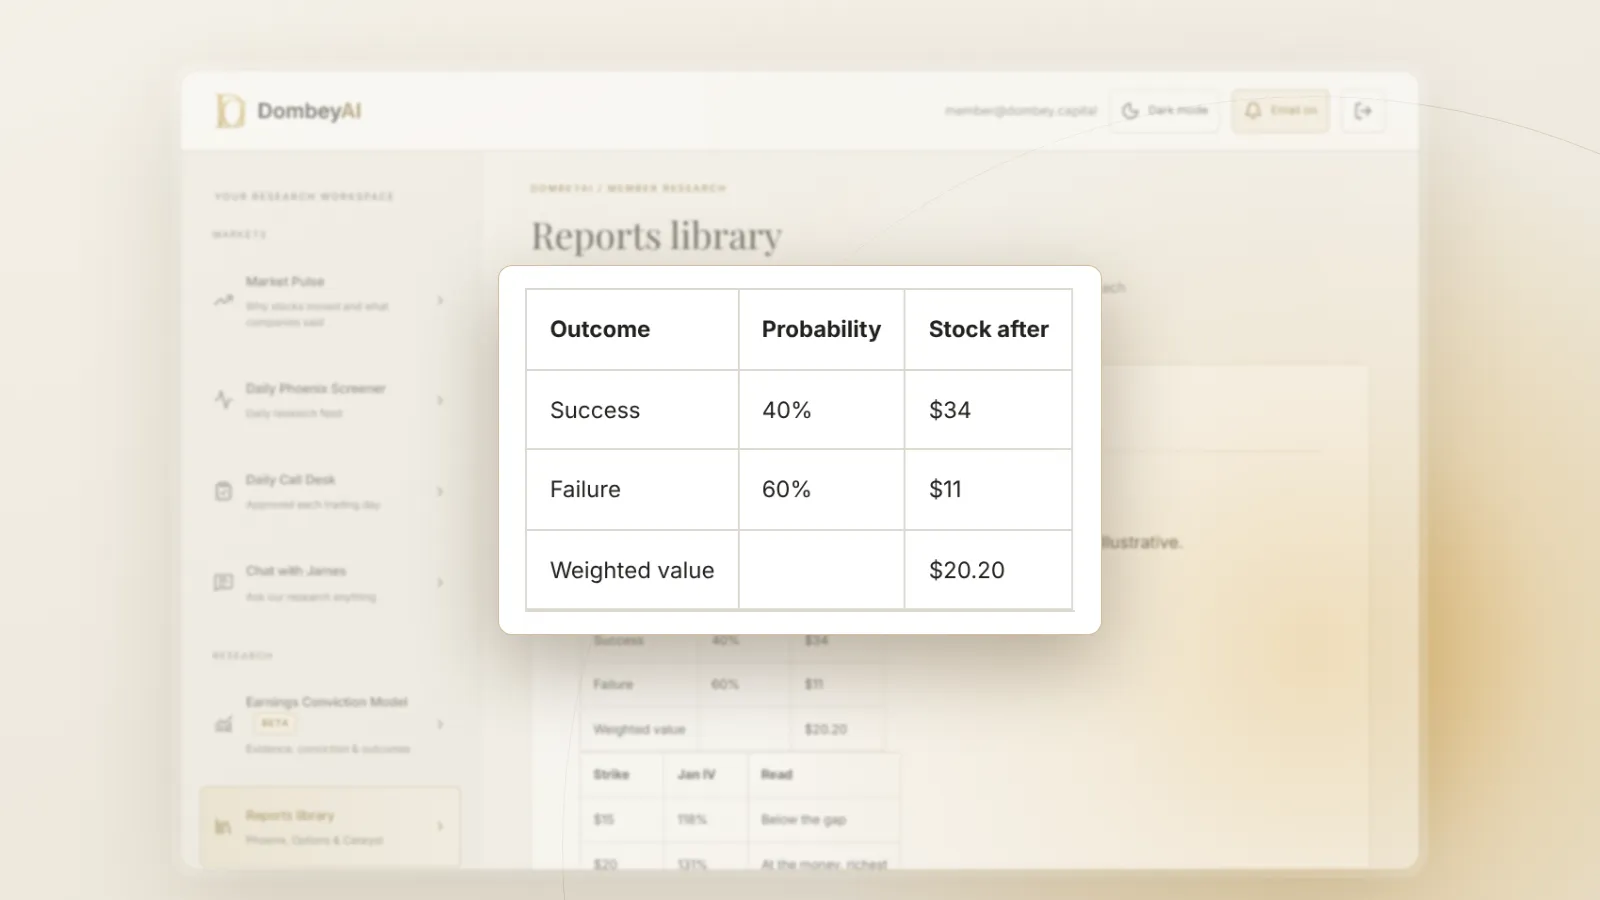
The example shows the key point: the value of the straddle depends on the two outcome prices and their probabilities, not on any volatility number. A scenario table is the right tool. Our guide on probability-weighted valuation for binary events shows how to build one.
What happens to the Greeks
- Delta suggests a smooth change in option value per dollar of stock. Across a gap, the option jumps from one value to another.
- Gamma for at-the-money options looks huge into the event, which says only that delta is unstable.
- Vega suggests sensitivity to small changes in implied volatility, but the real exposure is to the collapse after the event. See IV crush.
- Theta concentrates around the event date rather than accruing evenly.
The option Greeks remain useful for understanding exposures, but not for predicting profit and loss across the event.
A checklist before trading around a binary event
Use these checks before putting on any option position into a two-outcome event.
| Step | What to check | Where to find it |
|---|---|---|
| 1 | The event date, and whether it can slip | 8-K, press releases, court or agency calendars |
| 2 | The two outcome prices | Your own valuation of each case, peers, deal terms |
| 3 | Probabilities for each outcome | Base rates for similar events, your reading of the filings |
| 4 | The implied move in the chain | Straddle price for the expiry just after the event |
| 5 | The shape of the implied distribution | Butterfly prices across strikes |
| 6 | Liquidity | Bid-ask spreads and open interest at the strikes you need |
| 7 | The volatility after the event | Implied volatility in the following expiry |
Step 4 is the quick comparison. If the straddle costs less than the probability-weighted absolute move from your scenario table, options look cheap for the event. If it costs more, they look expensive. Our guide on how to choose an option strike and expiry for a catalyst covers the structure choices that follow.
Step 7 matters because the position must be closed or held after the event. If the next expiry's implied volatility is far lower, any time value left in your options will shrink sharply the day after.
Where this goes wrong
- Your probabilities are wrong. Most errors come from the scenario inputs, not the model. Check them against base rates for similar events.
- The outcomes are not clean. A partial approval, a delayed ruling or a mixed trial result can land the stock between the peaks.
- The event date moves. A delay shifts the catalyst past your expiry, and the option loses its event premium.
- Liquidity. Wide spreads can absorb much of the expected edge, especially in small caps. Our page on options liquidity covers this.
Dombey's published Options Research applies scenario pricing before dated catalysts; see the research archive. For live situations with dated events, see Dombey's market coverage.
The bottom line
Binary events create two-peaked outcomes that standard option models cannot describe. Implied volatility still quotes the price, but before the event it is a fitting number, which is why smiles bend and Greeks mislead. Build a scenario table with outcome prices and probabilities, compare it with the option prices, and check the implied distribution from butterflies. Then plan for the volatility collapse that follows the event, whichever way it goes.