

Why option prices contain probabilities
An option's value depends on the range of prices the stock might reach by expiry and how likely each is. Turn that around and the market prices of options across many strikes tell you what distribution of outcomes the market is pricing.
You do not need a model to extract the core figure. A call spread that pays a fixed amount if the stock finishes above a level is close to a bet on that single outcome, and its price reveals the odds. If the terms are new, our explainer on vertical spreads covers how they are built and priced.
Method 1: the narrow call spread
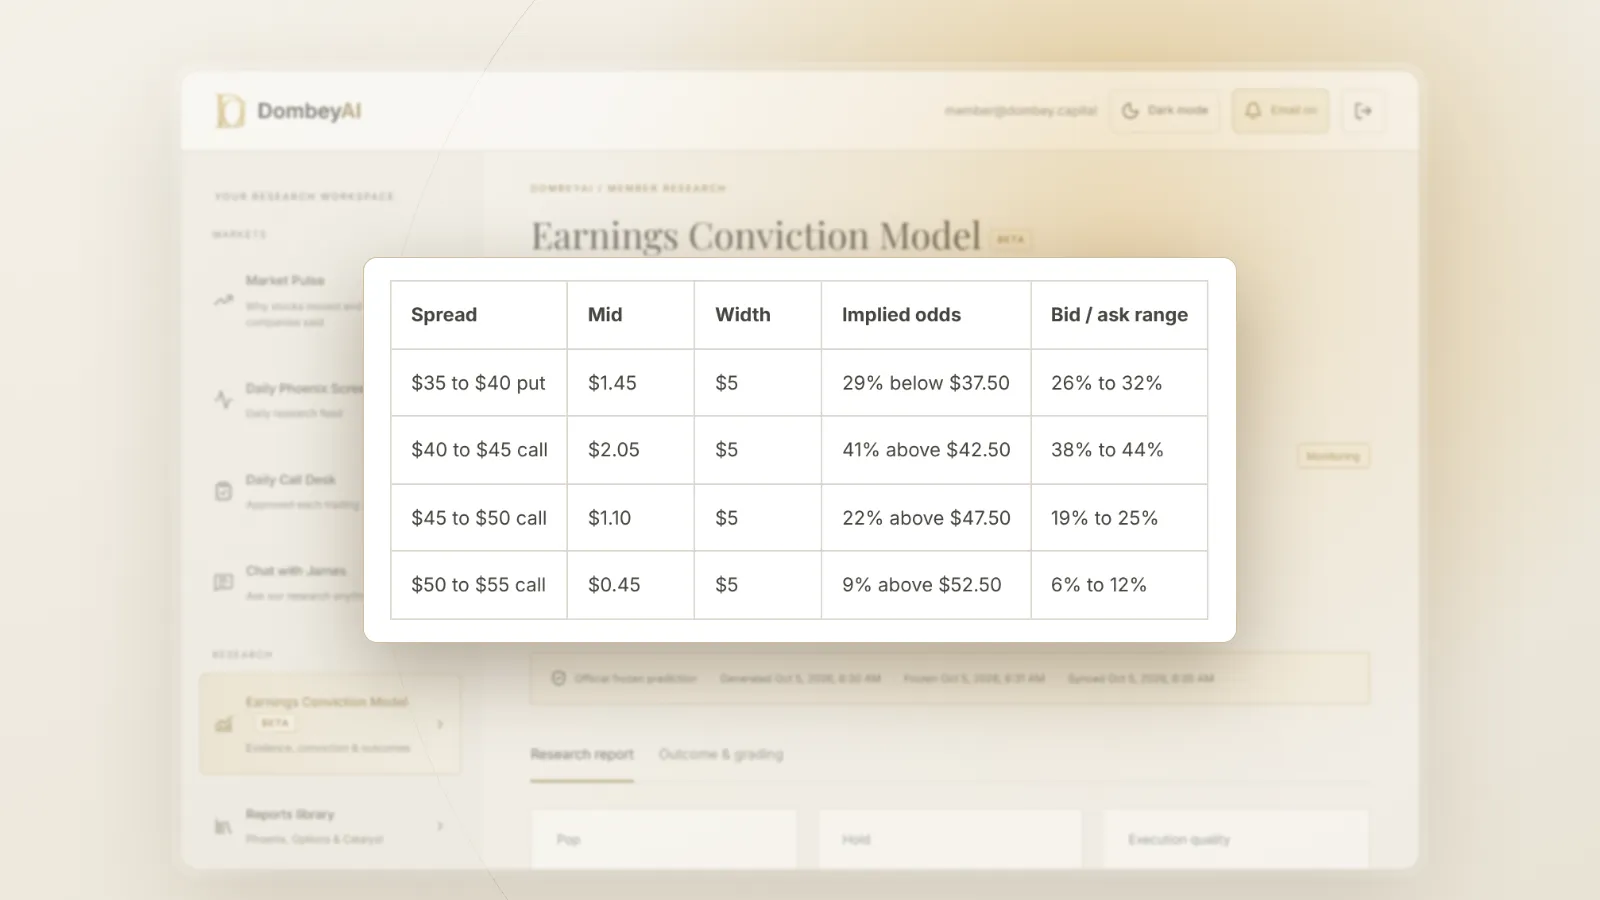
A call spread uses two strikes in the same expiry: long the lower strike, short the higher. At expiry it is worth the full strike width if the stock finishes above the upper strike and nothing if it finishes below the lower strike.
So the spread's price, divided by its width, approximates the market's implied probability that the stock finishes above the strikes. The narrower the spread, the closer the approximation, provided both strikes are actively quoted.
Put spreads work the same way for the downside. A narrow put spread's price over its width approximates the probability of finishing below the strikes. Put-call parity, covered in our explainer on put-call parity, ties the two together, so both sides should agree when quotes are clean.
Method 2: delta as a quick proxy
Many traders use an option's delta as a shortcut for the probability of finishing in the money. A 30-delta call is read as roughly a 30% chance. It is quick and the number is on every option chain, but it is an approximation:
- Under Black-Scholes, the risk-neutral probability of finishing in the money is a related term, usually a little lower than a call's delta.
- The gap grows with higher volatility and longer time to expiry.
- Delta comes from a model and its volatility input, while the spread method reads prices directly.
For short-dated options at ordinary volatility, delta and the spread method usually land close together. For long-dated options or high volatility around a catalyst, the spread method is more reliable. Our explainer on the option Greeks covers delta in more detail.
Method 3: butterflies and the full distribution
A butterfly combines three strikes: long one low strike, short two middle strikes, long one high strike, equally spaced. It pays the most if the stock finishes at the middle strike and nothing outside the wings. Its price, divided by the strike spacing, approximates the implied probability of the stock finishing near the middle strike. Our explainer on the butterfly spread covers the structure.
Price butterflies centered on each strike in an expiry and you get a rough histogram of the market's implied distribution. That shape says more than any single number:
| Shape | What it looks like | What it suggests |
|---|---|---|
| Single peak, symmetric | One hump around the current price | No large event priced; ordinary uncertainty |
| Single peak, left tail heavy | More weight on large declines | Demand for downside protection, typical in equities |
| Two peaks | Humps above and below the current price | A binary event, such as a trial readout or a deal vote |
| Very wide, flat | Weight spread across many strikes | High uncertainty, often before major news |
The heavier left tail is what options skew looks like when translated into probabilities.
Implied odds around binary catalysts
Special situations often have two outcomes. A merger closes or breaks; a drug is approved or rejected; a court rules for or against. Options that span such an event tend to price a distribution with two peaks.
A rough way to read the odds: estimate where the stock would trade under each outcome, then check how much probability the options put above and below the midpoint between them. If a target stock has a deal price of $30 and a likely standalone value of $20, a call spread centered near $25 shows roughly how much weight the options market puts on the deal closing.
Compare that with the odds implied by the stock itself. In a cash merger, the stock price against the deal price and the downside gives another implied probability; see merger arbitrage explained. For a full framework that combines outcomes and odds, see probability-weighted valuation for binary events. When the two markets disagree, one of them may be missing information, or one may simply be less liquid.
Where this goes wrong
- Treating risk-neutral odds as real-world odds. Investors pay a premium to insure against large declines, so implied odds of a crash run higher than the real chance. Implied odds of large gains can be lower than real.
- Using illiquid strikes. A wide bid and ask can swing an implied probability by many points. Our piece on options liquidity explains how to check quotes before trusting them.
- Ignoring early exercise and dividends. American-style options and dividends slightly change the payoff and therefore the implied odds, mostly in deep in-the-money options.
- Reading too much into one expiry. Different expiries span different events. A probability from an expiry before the catalyst says nothing about the catalyst.
- Mistaking demand for information. A large order can move a strike's price for reasons unrelated to the outcome, such as a hedge.
- Forgetting the outcome levels are guesses. In a binary event, the implied odds depend on where you think the stock trades under each outcome. Change those levels and the implied odds change.
How to use implied probabilities in research
Implied probabilities are most useful as a comparison:
- Form your own estimate first. Write down your probability for the event and the price under each outcome.
- Read the market's odds. Use the spread method in the first expiry after the event, with mid prices and a bid-ask range.
- Compare. A gap between your view and the market's is a reason to look harder, not a conclusion.
- Check the stock. In a deal or a binary event, compare option-implied odds with what the share price implies.
- Record it. Note the implied odds and your estimate on the date, so the comparison can be reviewed later.
Dated, priced catalysts and the moves that follow them are covered on Dombey's market pages.
The bottom line
Option prices imply the market's odds of a stock finishing above or below a price at expiry. A narrow vertical spread gives the cleanest read, delta gives a quick proxy, and butterflies across strikes sketch the whole implied distribution, including the two peaks of a binary event. These odds are risk-neutral and shaped by supply and demand, so they show what is priced, not what will happen. Use them as a benchmark for your own estimate, and check the quotes behind them before trusting the number.