

What you need
- At least ten years of annual results, ideally covering one full downturn and one upturn. The 10-K archive on EDGAR goes back far enough for most US companies.
- Revenue, operating profit, capital spending, depreciation, debt and share count for each year.
- One or two industry indicators that lead the company's results: a commodity price, capacity utilization, order backlog, inventories or a book-to-bill ratio.
- A spreadsheet. A simple financial model is enough.
Step 1: Place the company in its cycle
Before any multiple, decide where the company is. Plot revenue and operating margin for ten years and mark the peaks and troughs. Then look at the industry indicator you chose and ask whether it is rising, falling or flat.
| Signal | Near a peak | Near a trough |
|---|---|---|
| Operating margin | Well above its ten-year average | Near zero or negative |
| Capacity utilization | High, new capacity announced | Low, plants idled or closed |
| Capital spending | Rising above depreciation | Cut below depreciation |
| Inventories | Building at customers and in the channel | Being drawn down |
| Management tone | Talk of a "new normal" | Cost cutting and covenant talk |
The point is not to forecast the turn. It is to know which way current earnings are likely to be biased compared with the average.
Step 2: Find the mid-cycle margin
Average the operating margin across the full period. A ten-year average usually captures at least one downturn. If the business has changed, for example after an acquisition or the sale of a segment, adjust the history or shorten the window to the comparable years.
Margins are more stable than earnings because they remove the effect of growth. A company whose revenue doubled over ten years would show a rising earnings trend that hides the cycle. The margin shows it.
This is the same idea as normalized earnings, and it is the logic behind the CAPE ratio, which averages ten years of earnings for the whole market.
Step 3: Pick a sustainable revenue base
Apply the mid-cycle margin to a revenue figure that reflects today's capacity and market share, not the peak and not the trough. Common choices:
- The average revenue of the last cycle, adjusted for inflation and capacity changes.
- Current capacity multiplied by a mid-cycle utilization rate and a mid-cycle price.
- For a commodity producer, expected volumes multiplied by a long-run price assumption, the approach used in valuing a mining stock and an oil and gas producer.
Write down the price or utilization you assume. It is the single biggest input.
Step 4: Convert to normalized earnings and free cash flow
From normalized operating profit, subtract normal interest and taxes to get normalized net income, and divide by diluted shares. Then check cash. Cyclicals are capital-heavy, and some report profits while spending more than depreciation every year to stand still.
Split capital spending into the part that keeps capacity running and the part that adds capacity. The split is covered in maintenance capex vs growth capex. Normalized free cash flow is normalized operating cash flow minus maintenance spending only.
Step 5: Stress the balance sheet against a trough
This is the step that matters most. Take the worst year in your history and apply its margin to today's revenue. Then check:
- Does operating profit cover interest? See the interest coverage ratio.
- When does debt mature, and could the company refinance in a downturn? A debt maturity wall that falls in a trough year is the classic way cyclicals fail.
- Do covenants tighten as earnings fall?
- How much cash does the company burn at the trough, and how long could it last?
A company that cannot reach the next upturn without diluting shareholders or restructuring debt is worth much less than its normalized value.
Step 6: Apply multiples to normalized figures
Use multiples on the normalized numbers, not on the current year:
| Measure | Use it when | Watch for |
|---|---|---|
| P/E on normalized earnings | Profits are positive across most of the cycle | A margin history that no longer applies |
| EV to mid-cycle EBITDA | Comparing companies with different debt loads | Ignoring heavy capital needs |
| Price to book or tangible book | Near a trough, when earnings are negative | Book values inflated by old acquisitions |
| Price to replacement cost | Asset-heavy industries such as steel or shipping | Assets that are obsolete, not merely cheap |
For the trade-offs of the enterprise value measure, see EV/EBITDA uses and blind spots. For the book value approach, see price-to-book explained.
Step 7: Build three cases
Turn the work into a range. The method is set out in how to build a base and worst case.
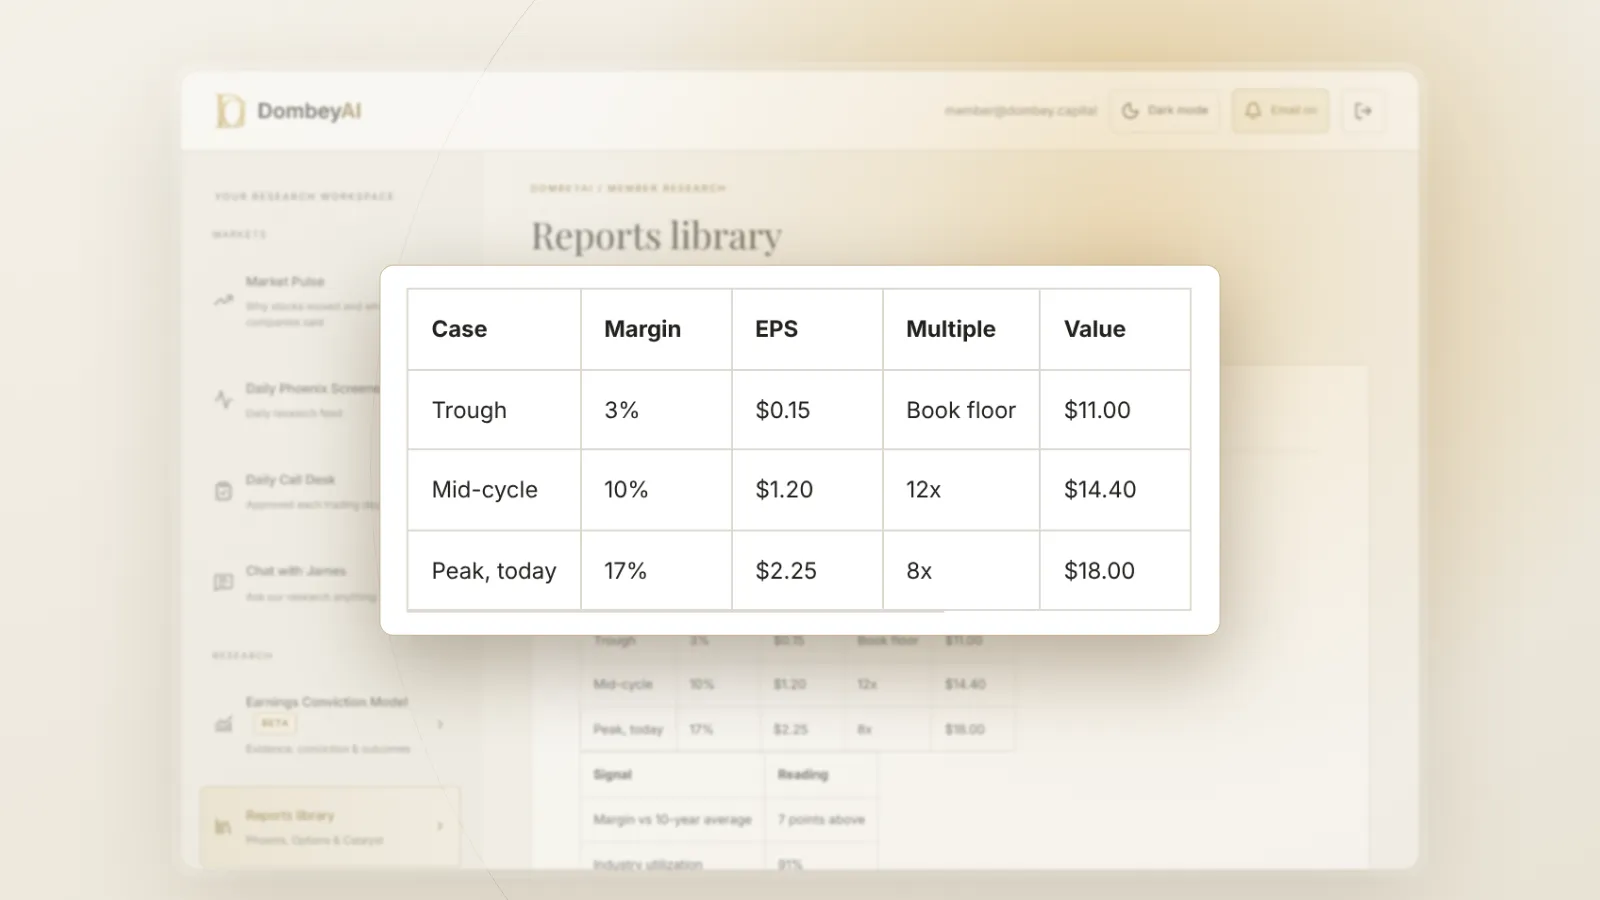
| Case | Margin | Operating profit | Net income | EPS | Multiple | Value per share |
|---|---|---|---|---|---|---|
| Trough | 3% | $60 million | $15 million | $0.15 | Book value floor | About $11 |
| Mid-cycle | 10% | $200 million | $120 million | $1.20 | 12x normalized | $14.40 |
| Peak | 17% | $340 million | $225 million | $2.25 | 8x peak | $18.00 |
At the peak the stock might trade at 8 times earnings, around $18. The mid-cycle case gives $1.20 per share at 12 times, about $14.40. The trough case falls back on book value of about $11. A buyer at $18 who sees a P/E of 8 is paying more than the normalized value of about $14. The low P/E is the trap.
Step 8: Write the turning signal into the thesis
A cyclical position needs a dated reason to change view. Write down the indicator you will watch, the level that would make you revise the case, and the date of the next data point. A dated investment thesis keeps the view honest when the cycle turns faster than expected.
Most data platforms can chart ten years of margins. Our list of the best stock research tools for individual investors covers which ones show long histories without a terminal subscription.
Common mistakes
- Using the current P/E. It is lowest at the peak and highest at the trough, the opposite of what it seems to say.
- Averaging too short a period. Five years of an upturn is not a cycle. Include at least one downturn.
- Treating a structural decline as a cycle. Some industries do not come back. If demand has moved permanently, the old average margin is not coming back either. That is how a cyclical becomes a value trap.
- Ignoring operating leverage. High fixed costs make profits swing much more than revenue, as covered in what operating leverage is. Small revenue errors become large profit errors.
- Skipping the trough test. The normalized value assumes the company is still there for the next upturn.
- Counting all capex as maintenance or all as growth. Either choice distorts normalized free cash flow.
The bottom line
Value a cyclical stock on its earnings across a full cycle, using an average margin applied to a sustainable revenue base, and treat the current year's P/E as a signal of where the cycle is rather than of value. Test the balance sheet against a trough before applying any multiple, because survival is the condition for earning the normalized figure. Use book value and replacement cost when earnings are depressed. Then build a range of cases and write down the indicator that will tell you the cycle has turned.